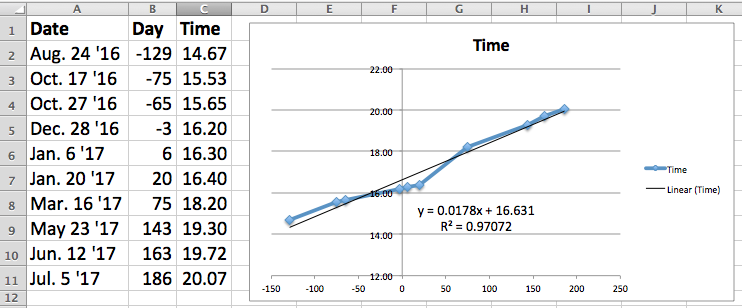
I've been able to explain the time stamp of the script running changing over time by plotting the day of the year compared to the time of the post, decimalized by adding the 24 hour hour to the minutes in the form of n/60 (e.g 4:12 pm --> 16:12 --> 16+(12/60) --> 16.20).
I excluded the three events occurring at the same exact time and the August event that crossed the date line. Negative numbers are 2016 and positive numbers are 2017.
While there are some numbers that deviate from the pattern slightly right around the beginning of the year, all of the rest of the numbers form a nearly perfect line with a trendline with an R2 value of 0.97.
You can see this more clearly when I remove the three events in December and January... because even scripts get a bit lazy during the holidays.
The trendline now has an R2 value of 0.99956!
So, given this, it seems safe to assume that there are no feet beyond the curtain, merely a drifting script.


