31

I've been involved with matheducators.stackexchange.com and a little bit with expatriates.stackexchange.com. I've noticed that both had very high activity during private beta and then about half as much activity during public beta (which makes sense, because people are trying to get the site going during private beta).

However, I've noticed that many other, older beta sites have a large number of questions but few questions/day. I assume that they, too, grew fast at the beginning and then slowed down.

My question is, what is the typical pattern in terms of questions and answers per day in the typical new beta site? Do they tend to follow the same statistical model? Most importantly, is there a difference between those that succeed and those that fail, or does it not show up until later?

I'd like to know so that if and when the questions slow down, we'll have some perspective on what is normal and what is not.

1
  • 3
    there are a lot of questions in the private beta because the committers have been saving them up. That drops not because of entering public beta but because the stockpile is exhausted. From then on questions arise more organically but the rate should always be increasing. If the rate falls off over time (after the initial spike) then the site is not succeeding. Commented Jun 2, 2015 at 13:43

2 Answers 2

32

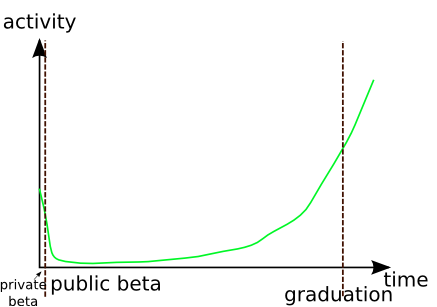
This is a typical growth pattern for a Stack Exchange site. The scale is highly variable but most sites go through similar phases.

typical growth pattern graph

rolfl wrote a Data Explorer query which shows actual examples (see a few recently-graduated ones here). The initial slump is not always visible at this scale.

The sites that fail in private beta start are mostly the ones that peter out on day 2. The sites that fail in public beta are the ones where there is no growth at all and the existing community drifts off. The flat bit at the beginning of the public beta can last for many months; as long as an engaged community remains active, there isn't really a time limit.

What you don't want to see during the beta is the long-term growth tapering off. There may be exceptional events and seasonal variations, but after smoothing these off, you should see the initial activity reduction slow down and then growth happening at a faster and faster rate (in mathematical terms, activity should be a convex function).

0
26

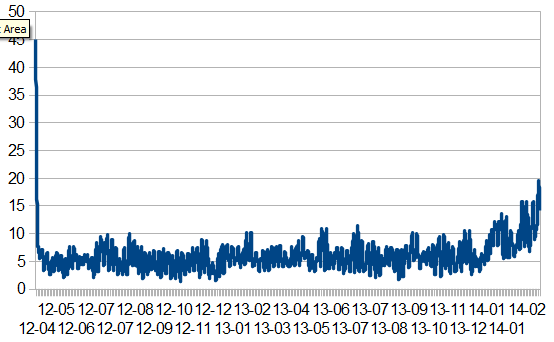
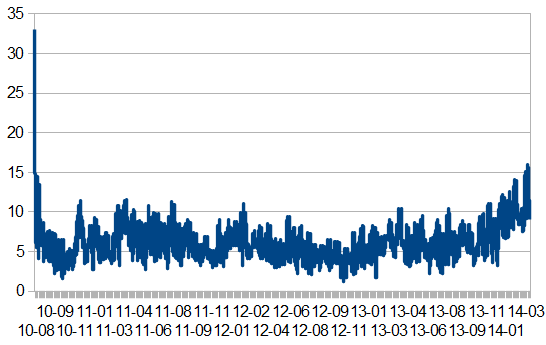
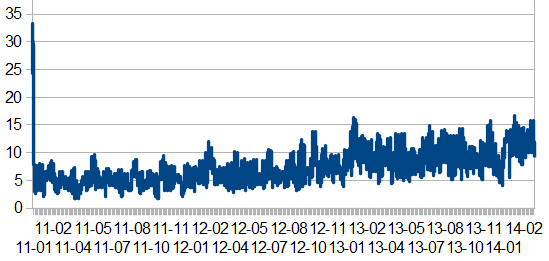
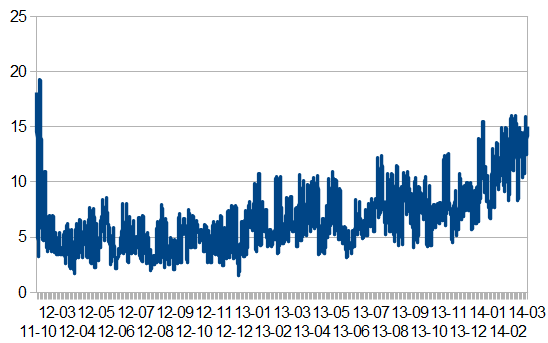
Some data to complement the sketch given by Gilles. I picked two recent graduates and two beta sites that are just about to graduate. The graphs show posts per day. I used moderate smoothing, trying not to lose the sharp peak at the beginning.

Workplace graduated 2014-02-21

Workplace

Money graduated 2014-02-26

money

Graphic Design is getting its own design.

design

Academia will get one on 6-8 weeks

academia

1
  • Does not seem to be a good indicator. Computer Science has had more than 15 posts per day for a long, long time (but has not graduated).
    – Raphael
    Commented Jun 2, 2015 at 11:09

You must log in to answer this question.

Not the answer you're looking for? Browse other questions tagged .