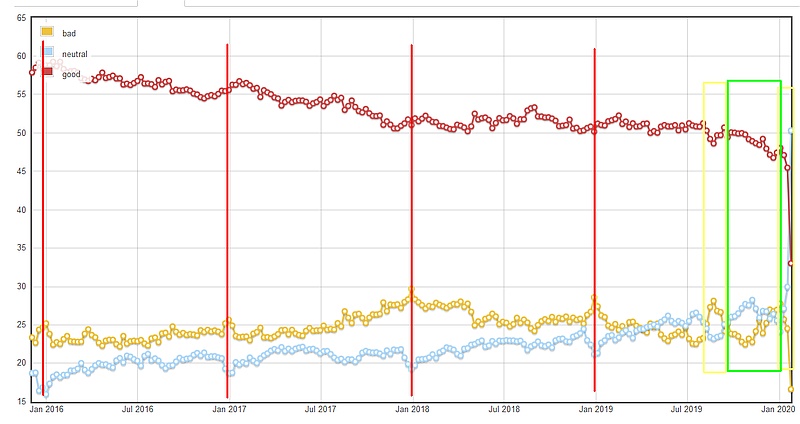
Executing the data-explorer query originally made by Jon Ericson in 2017 (see How is question quality measured in A/B tests?), where he categorizes the questions as:
- good (not-closed and with a positive score or with score zero but with answers)
- neutral (not-closed, score 0, no answers)
- negative (closed or negative score)
and looks at the relative evolution, i.e. the time dependent behavior of the number of new such question as percentage of total new questions.
The graph for the last four years for Stack Overflow looks like:

The x-axis is time and the y-axis is percentage of good/neutral/bad questions asked at a certain time. I marked some features. Christmases (red vertical lines) show a relative drop in neutral questions and an increase in bad questions. Either people ask considerably worse questions around Christmas or reviewing activity is increased relatively around that time or both.
Furthermore, there is a first yellow box around August 2019, which marks the 3-close votes experiment on Stack Overflow (bad questions increased and neutral as well as good questions dropped) as well as the second yellow box since December 2019, which is the last months or so, which is influenced heavily by the now permanent 3-close votes condition as well as Christmas as well as the Pronoun/Monica/Shog developments. The last two months are difficult to interpret and I would prefer to wait a couple of months more and see how activity continues.
And there is the green box, which is September 2019 to December 2019, which indeed sees a significant but not very big change in these quantities. In that green box, I would say, the relative number of good questions has decreased even faster than the long term trend, the number of neutral question also increased to a four year high (somewhere in October/November). There might have been a dip in review activity of new questions, which however was more than compensated by the change to 3 close votes in December 2019.
There is the long term trend of fewer and fewer questions with positive scores or answers that score positively on Stack Overflow (see also Why is the rate of positively scoring questions and answers steadily declining?). This long term trend seems to be intact.
I did similar computations also for a couple of other Stack Exchange sites and I think I remember a similar behavior for Mathematics at the very least. Some people describe this as "mission accomplished", where most of the most important questions in a field that are suitable for a Q&A like here have been asked and answered.
The fluctuations in these graphs are large enough that one cannot say anything else with certainty, and the effect of the September 2019 turmoil may only be temporary and not lasting, but if anything it has accelerated the long term trend, I would say.

