24

How, exactly, are all the Area 51 beta stats calculated?

For example:

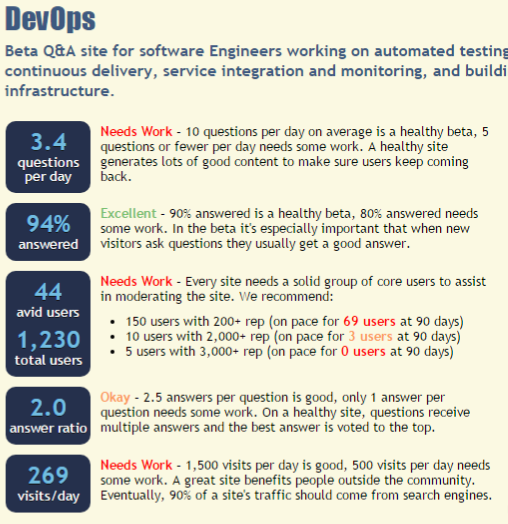
    enter image description here

This shows an answer ratio of 2.0. Yet, unless my query is broken, I couldn't get that number (even with today's freshly updated SEDE data):

What                 Answers Questions AnswersPerQuestion 
-------------------- ------- --------- ------------------ 
All                  444     252       1.761904761904     
All not deleted      429     229       1.873362445414     
Open and not deleted 401     208       1.927884615384    

Or, for example, questions per day yields:

All                  6.461538461538 
All not deleted      5.871794871794 
Open and not deleted 5.333333333333 

None of these are 3.4.

I'm using the above specific stats as examples but I'd like to know how every stat there is calculated. I haven't been able to calculate any stats that match any of those displayed for a site, for all of the stats listed there. The FAQ is silent on the matter, no help center exists, and so far my MSE searches have been fruitless.

The question ends here. Everything below is me doing experiments to try and figure this out based on answers and theories and such.


Experiments

Questions/Day

SEDE was updated this morning so now is a good time.

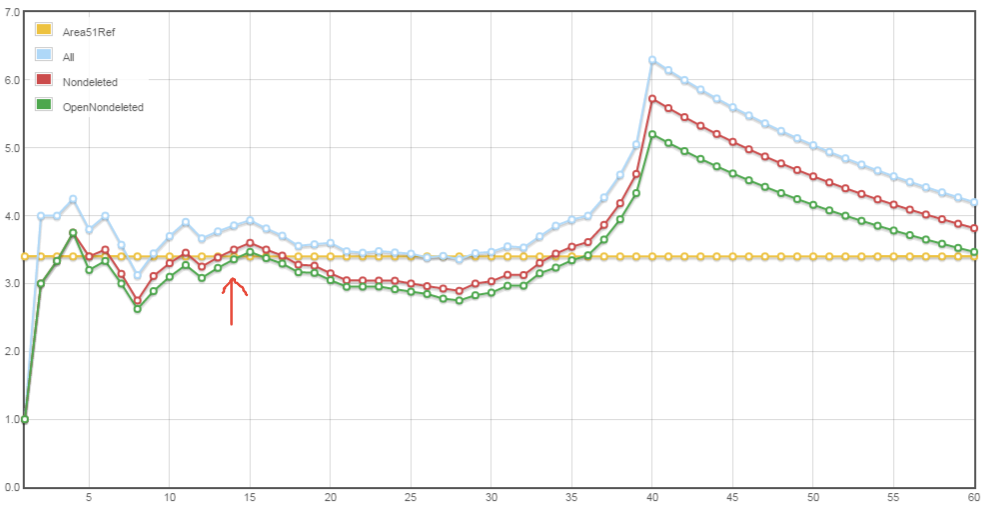
Questions per day. Going off suggestion to look at past two weeks, this query shows # days on X axis and questions / day over that number of days in the past:

enter image description here

It crosses the line a few times but also confirms a 14 day history for non-deleted questions. It is not clear yet if closed questions are counted. Also there is a tool-tip over the Area 51 stat that says "past two weeks".

% Answered

No idea. Did not investigate thoroughly, however.

Avid Users

Definitely >= 200 rep, confirmed. Total users seems to be the obvious although its tool tip is incorrect (it also says "over 200 rep" in the tool tip).

Answer Ratio

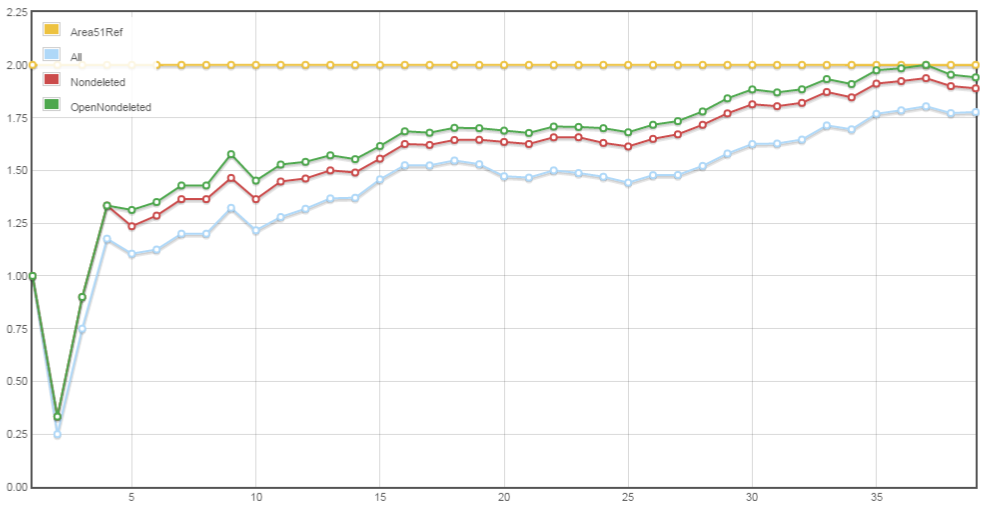
Similar query as above:

enter image description here

From this:

  • It is definitely not past 14 days.
  • It appears to be either the maximum value ever obtained for open, non-deleted questions, or it's the average over the past 37 days. Both are weird.
  • However, for this I filter based on question creation date. Maybe the real criteria is different.

The DevOps page itself today says 431 / 230 = 1.87 in the side bar, so that's not it.

Visits / Day

Did not verify, but:

So it's probably safe to say that this one is median visits per day over past two weeks.

6
  • The a51 beta page is refreshed daily, while the sede only weekly, it may be a cause of the difference.
    – peterh
    Commented Apr 8, 2017 at 20:50
  • @peterh I'd buy that, except on the site stats on the sidebar for devops.stackexchange.com, for example, it shows 427 answers and 229 questions = 1.86 right now, which still isn't 2.0. SEDE will update tomorrow and I'll update my output then to see how far off it is, but evidence suggests there is something else to it. And then there's the other stats, like what are "avid" users? Etc.
    – Jason C
    Commented Apr 8, 2017 at 20:54
  • I think you are right, some other could also exist. Your query looks pretty good, thanks for the beautiful float conversion trick :-) Note, if a question is deleted, all of its answers is deleted, too, I think you can trust the system in it.
    – peterh
    Commented Apr 8, 2017 at 21:00
  • 1
    If I run this against the API I don't get much different results: jsfiddle.net/uo3arbod I doubt SEDE is the issue here.
    – rene Mod
    Commented Apr 8, 2017 at 21:22
  • Related.
    – Mithical
    Commented Apr 9, 2017 at 8:16
  • 2
    I'm going to post a CW wiki here summarizing 100% confirmed details from all answers and sources (working on it now) and probably propose it for a FAQ entry once complete. The answers below so far have filled in some excellent pieces of the puzzle.
    – Jason C
    Commented Apr 9, 2017 at 14:49

3 Answers 3

15

Questions per Day

You can hover over the number to see the tooltip which says "3.5 questions per day on average over the last two weeks". I'm assuming that by average, it's referring to the mean.

Percentage Answered

According to this post:

We use numbers returned by the public /stats api, e.g. http://api.gaming.stackexchange.com/1.1/stats:

answeredPercentage = 100 - (total_unanswered / total_questions * 100);
answerRatio = total_answers / (total_questions * answeredPercentage / 100);

But slightly confusingly, the api's return values for total_questions and total_answers include closed questions, but total_unanswered doesn't.

So, answeredPercentage ("% answered" on the stats page) is actually "percentage of questions that have been resolved" ...either by an answer or by closing.

I found this query which seems to suggest that formula is still the same (93.8% answered according to SEDE, 94% displayed on Area 51).

'On Pace' Statistics

According to this comment:

Zero per 30 days is equivalent to zero per 90 days. One per 30 days is equivalent to three per 90 days. Assuming that trusted user bonus doesn't count and the 5 points were only updated recently, twenty-five per 30 days is equivalent to 75 per 90 days.

However, I tried the figures, and it doesn't seem right: 44 users with > 200 rep on after 39 days, hence (44/39) users/day, hence on pace for (44/39)*90, which equals 102 users. Area 51 displays 69 users. I wonder if this is averaged over the last two weeks like the other figures?

Answer Ratio

The 'Answer Ratio' is given by total answers / (total questions * answered percentage / 100);, as stated in the quote under 'Percentage Answered'.

Hence, the formula is, in effect: total answers / (questions with at least one answer + questions with no answers and are closed)

Views per Day

Like the questions per day, this is just averaged over two weeks (despite the tooltip not being there for the views). I've confirmed this on IoT using the site analytics, and it does seem to be correct, though.

3
  • Awesome. Did some experiments myself: Questions/Day seems to be two weeks, excluding deleted questions, unsure about closed ones. View/day: Looks like the number matches stackexchange.com/sites#traffic and the tooltip there suggests it's the median over two weeks.
    – Jason C
    Commented Apr 9, 2017 at 14:45
  • Btw I'm going to post a CW wiki here summarizing 100% confirmed details from all answers and sources (working on it now). Thanks for these excellent puzzle pieces.
    – Jason C
    Commented Apr 9, 2017 at 14:48
  • 1
    @JasonC Just checked in the mod analytics on IoT, and the views per day are indeed based on the median. I'll see what I can figure out with the questions and update you.
    – Aurora0001
    Commented Apr 9, 2017 at 14:50
6

A partial answer to your question can be found in the accepted answer to "how can we have a 31-day old site with >14k views, but only 138 visits/day?", which states:

The "visits/day" number is the median number of daily visits for the past two weeks. Traffic from HN causes a spike for a day or two, but does not affect the median that much

So try to only take into consideration the last 2 weeks, and see to what extends you can get your math correct.

Some more details about those stats, specific to the DevOps.SE site (similar observations should apply for all Area 51 beta stats):

  • Avid users:

    Right now there are 44 users at DevOps.SE with at least 200 rep (while there are 2 users with at least 2K rep). So it looks that the 44 avid users pretty much corresponds to the nr of users with at least 200 rep.

  • Total users:

    1,223 "total users" (as in your image) seems not correct, since the most recent new user has an id = 2232. Though about a week ago DevOps.SE welcomed the user with uid=1000). Not sure where that id = 2232 is generated from, but looking at the user pages this is what it currently says: Current total = 34(pages) * 36( on each page) + 4 (on last page) = 1,228 (= total number of users). So the 1,223 is probably from last night or so.

    About "(On pace for X users at 90 days)": my (educated) guess is that this is to be understood like (eg for X = 2K) "if this site continues to evolve at the current speed / rate, then around eind of 5/2017 (= 90 days after Feb 28, 2017 when the site was launched), there will be 3 users with +2K rep (note: right now there are 2 ...), and no users yet with +3K rep)"

  • Visits/day:

    In Chat.devOps.SE, around March 25, there is a similar question about how to calcuclate those daily visits. Turned out to be (also) like "only consider the last 2 weeks".

Disclosure: I'm an early DevOps.SE participant

1
6

This CW answer can serve as a collection of information pieced together from other answers, posts, comments, and experiments. It is currently a work in progress.

Questions / Day

This is the number of questions per day over the past two weeks.

Uncertainties:

  • Evidence suggests this excludes deleted questions.
  • Unsure if closed questions excluded (TODO: Try on a site with more questions than DevOps).

Sources:

% Answered

TODO: Summarize (Aurora0001's answer).

Sources:

Avid Users

This is the total number of users with 200 or more rep.

Uncertainties:

  • Tool-tip claims "200 or more". Should verify that it's indeed >= rather than > (TODO: Test on other sites, at the time of this writing both are the same for DevOps).

Sources:

Total Users

Total number of users on site.

Sources:

"On Pace"

TODO: Investigate (Aurora0001's answer has starting point, see also How are the "on pace for" metrics on Area 51 generated and are they being done so correctly?).

Answer Ratio

TODO: Eat breakfast. Also Aurora0001's answer has starting point.

Visits / Day

Median number of visits per day over past two weeks.
Source:

  • Strong evidence, number in Area 51 matches number on sites summary, and tool tip on that page reads "median visits per day over the last two weeks".

  • Manual counting of results in the site analytics available to users seems to confirm this—the median exactly matches the Area 51 statistics, but the mean does not.

1
  • I'm sorry; I think I have enough info to update this but a pet emergency came up recently and I have not been able to focus. I will come back to this.
    – Jason C
    Commented Apr 18, 2017 at 17:05

You must log in to answer this question.

Not the answer you're looking for? Browse other questions tagged .