22

Most visitors to Area51 will have a strong interest in the development of the entire network. It would be nice to see, in graphical form, how some of these stats vary over time:

  • Number of proposals
  • Number of commitments
  • Number of votes
  • Number of users

Also for each site that reaches public beta, there are currently some stats available on its Area51 page. It would be awesome to see here how these stats evolve over time.

1
  • 1
    +1 for the last sentence, about beta proposals. This would be great because it will give us an idea about whether how the stackexchange sites are faring. At the moment we've not really got any idea if it's going well, or poorly, especially if you're only committed to one or two of them. Commented Jul 29, 2010 at 6:18

4 Answers 4

7
+50

Just to elaborate on what I'd like to see (hence the bounty):

I'd love to see some graphs with all the new Stack Exchange sites overlayed with the number of questions/answers/users/comments etc so that we can see how well our beta sites are progressing.

Turn it into a bit of a competition/game, see if you can get your stats up the quickest, or promote your sites the most efficiently.

It'll also give you a good idea of how your site is progressing in regards to the other sites.

2
  • 1
    +1 - Site health statistics would be very helpful in determining how well the site is progressing and how well promotion is working. Commented Jul 30, 2010 at 13:52
  • @rchern - as I mentioned in the chat the other day, I've finally had a chance to roll my own Commented Aug 6, 2010 at 12:30
5

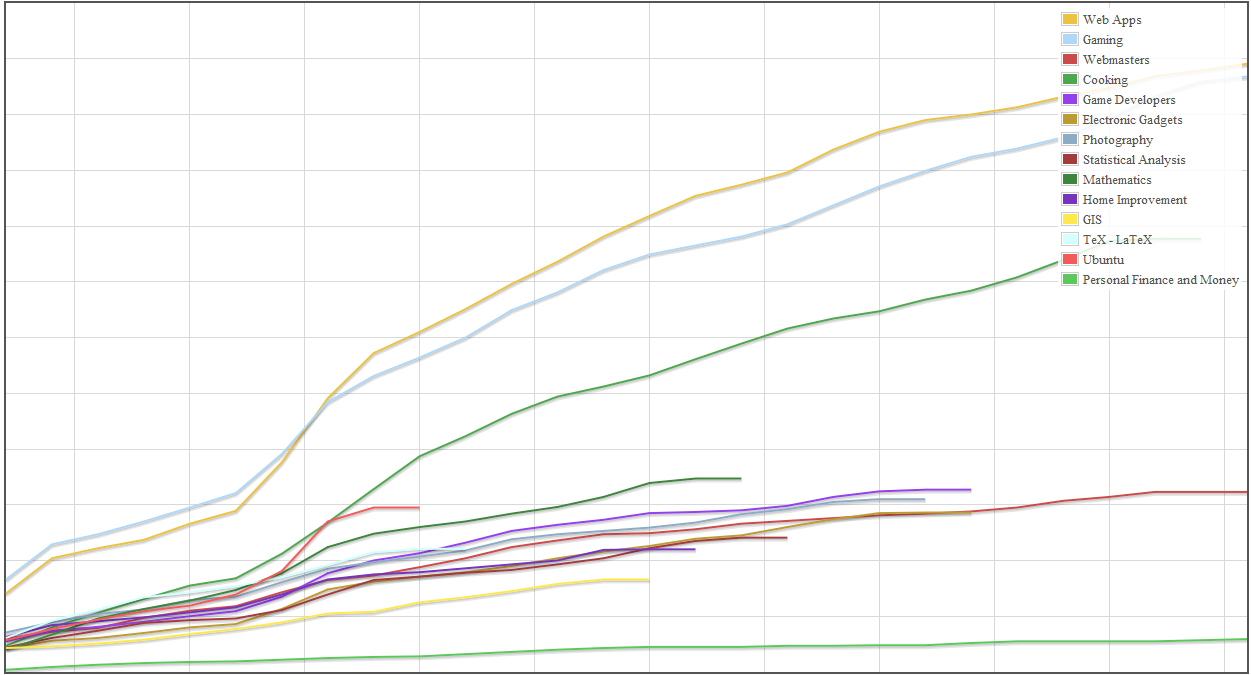
I've gone and made my own using the API. You can get it it from the Stack Apps site here.

alt text
(source: column80.com)

4
  • meta.stackexchange.com/questions/58391/…
    – juan
    Commented Aug 6, 2010 at 13:37
  • Hi, two questions, First: is the graph number of users over time (the axes have no labels nor units)? Second: the link to the API gives a 404 - Voluntarily removed. Did you move the code somewhere else? I only ask because I'm writing a script in Python that plots the stats of 3D Printing site over time. However, I am using data that I have saved locally over time. I was wondering how to query Area51 for historical stats on a particular date/week/month etc., hence why I wanted to take a look at your code. Thanks. Commented Apr 29, 2021 at 12:10
  • Wow, I have no idea if my code for this 11 year old one-off throwaway project still lives anywhere, to be frank. I will have to take a look. I'm fairly sure it uses the long-gone v1 of the API though Commented Apr 29, 2021 at 21:05
  • @Greenonline looks like I deleted the Stack Apps because I couldn't be bothered upgrading this to the new API, and I can't find the code anywhere at the moment. I'll let you know if that changes. Commented Apr 29, 2021 at 21:21
2

Statistics like these would also help to show the relevancy of the platform and therefore help to get people committed or interested into the sites.

OpenId should make it easy to add numbers like

  • number of distinct users
  • average number of pages users are involved in

If I look at the graphs proposed by the OP and others, I would like to see graphically enhanced (colored)

  • all my proposals
  • all my followed pages
  • all my committments
  • all pages I am user of

I am sure that this statistic would also be a wonderful tool to feedback the investors about the success of the platform SE2.0, without additional effort and paper.

1

Another reason I would like to see this, is to have an idea what influence the moderating has on these site metrics.

Will closing 'List of X' questions negatively effect the metrics or will it simply not matter?

Having some data to hold on to could at least help us evaluate what we're doing

You must log in to answer this question.

Not the answer you're looking for? Browse other questions tagged .