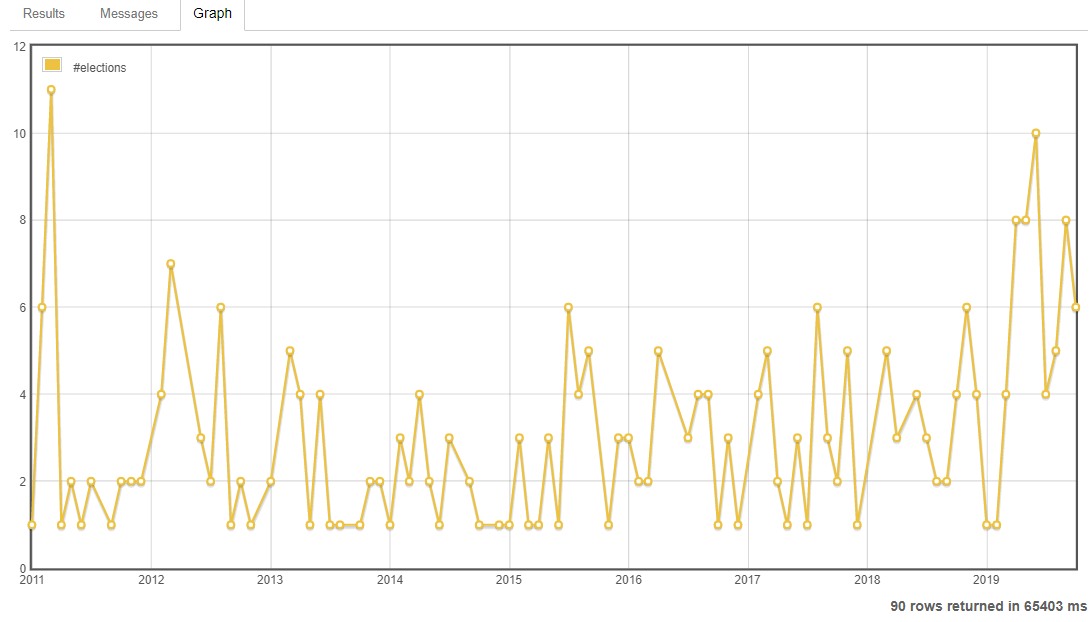
If we assume an election takes place after at least one member posted a nomination the following SEDE query will kind of reproduce that graph, using lines, instead of bars.
The query is a multi-database variant that takes nomination posts (those are found in the Posts table with posttypeid = 6) and allows for a date range to group those nominations to determine the month an election took place.
That query is then run for each main site database and stored in a temptable and then projected to produces the graph with count per month.
declare @sql nvarchar(max)

create table #result (site sysname
                    , hostname sysname
                    , electiondate datetime
                    , nominees integer
                    )

select @sql = N'insert into #result' + STRING_AGG(concat(N'
select ''', name ,N''' as site
     , ''',hostname ,N'''
     , eomonth(max_nom)
     , count(*) [nominees]
from (
    select pm.id
         , min(pm.creationdate) min_nom
         , max(pg.creationdate) max_nom
    from ', quotename(name), N'.dbo.posts pm
    inner join ', quotename(name), N'.dbo.posts pg on pg.creationdate
          between dateadd(d, -16, pm.creationdate)   -- roughly 14 days
             and dateadd(d, +16, pm.creationdate)
    where pm.posttypeid = 6
    and   pg.posttypeid = 6
    group by pm.id
    ) election_posts
group by eomonth(max_nom)
'),N'
union all')
from (select convert(nvarchar(max),name) name
    -- , convert(nvarchar(max),sitename)  sitename
    -- , meta
    -- , domain
     ,  concat(
        -- based on an idea from Glorfindel
        -- https://meta.stackexchange.com/a/321181
        (case sitename
        WHEN 'Audio' THEN 'video'
        WHEN 'Beer' THEN 'alcohol'
        WHEN 'CogSci' THEN 'psychology'
        WHEN 'Garage' THEN 'mechanics'
        WHEN 'Health' THEN 'medicalsciences'
        WHEN 'Moderators' THEN 'communitybuilding'
        WHEN 'Photography' THEN 'photo'
        WHEN 'Programmers' THEN 'softwareengineering'
        WHEN 'Vegetarian' THEN 'vegetarianism'
        WHEN 'Writers' THEN 'writing'
        WHEN 'Br' THEN 'pt'
        WHEN 'Mathoverflow' THEN concat((meta+'.'), sitename)
        ELSE case when sitename = domain then null else sitename end
        end +'.')
        , (case
           when sitename <> 'mathoverflow' then (meta+'.')
           else null
           end)
        , (case
           when sitename <> 'mathoverflow' then concat((domain + '.'), 'com')
           else 'net'
           end)
        ) hostname
from (
select name
, case parsename(name,1)
  when 'Meta' then parsename(name,2)
  else parsename(name,1)
  end [sitename]
, case parsename(name,1)
  when 'Meta' then 'meta'
  else null
  end [meta]
  , coalesce(parsename(name,3), parsename(name,2)) [domain]
from sys.databases
where database_id > 5
and (name not like '%.Meta') -- only main sites have elections
) dbs
) dbsall

exec (@sql)

select electiondate, count(*) [#elections]
from #result
group by electiondate
order by electiondate
When run today this is the result:

Keep in mind SEDE is updated once a week on Sunday.
Give a big shout-out to Monica Cellio for the awesome SEDE Tutorial she wrote.
Say "Hi" in SEDE chat.
 Image by Tim Stone
