In the CoGro Musings chat room, Tim Post mentioned
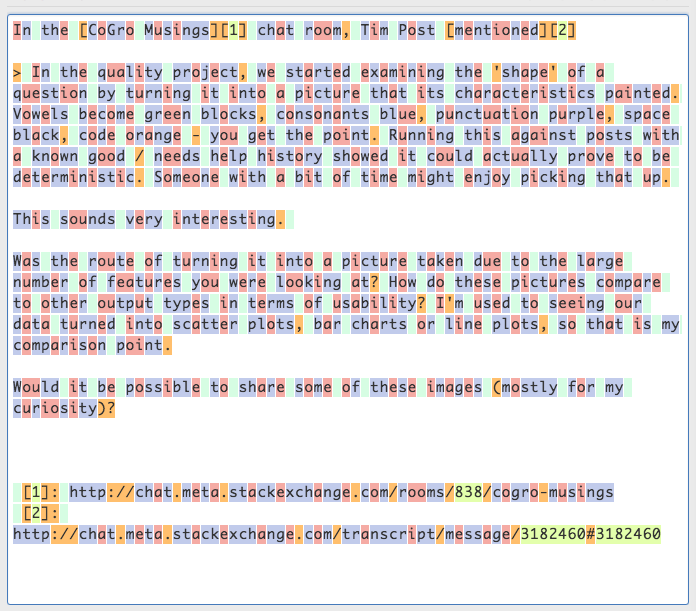
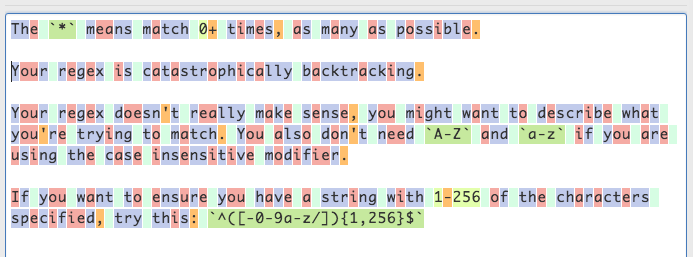
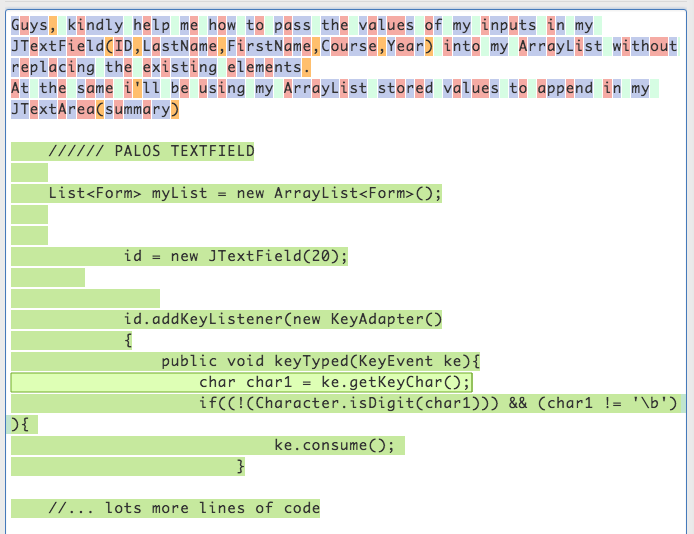
In the quality project, we started examining the 'shape' of a question by turning it into a picture that its characteristics painted. Vowels become green blocks, consonants blue, punctuation purple, space black, code orange - you get the point. Running this against posts with a known good / needs help history showed it could actually prove to be deterministic. Someone with a bit of time might enjoy picking that up.
This sounds very interesting.
Was the route of turning it into a picture taken due to the large number of features you were looking at? How do these pictures compare to other output types in terms of usability? I'm used to seeing our data turned into scatter plots, bar charts or line plots, so that is my comparison point.
Would it be possible to share some of these images (mostly for my curiosity)?


