As sites grow, there's a noticeable increase in community unhappiness with question quality. Quite a bit of the problem is simply a matter of scale, but sites sometimes optimize for extremes. Bad askers don't notice or care that their questions are bad and potential good askers tend to be more sensitive to criticism. A dangerous feedback cycle sets in where members of the site are rightly critical of new questions which discourages potentially good askers from asking which leaves a greater percentage of bad questions remaining.
We've heard lots of suggestions and we'd like to start testing some of them. But in order to do that, we need an objective measure of question quality. Or rather, we need an objective measure of the community perception of question quality, which is thankfully easier to obtain. As Clay Shirky says:
So the group is real. It will exhibit emergent effects. It can't be ignored, and it can't be programmed, which means you have an ongoing issue. And the best pattern, or at least the pattern that's worked the most often, is to put into the hands of the group itself the responsibility for defining what value is, and defending that value, rather than trying to ascribe those things in the software upfront.
Taking that to heart, we've defined a simple "question grade" based on objective measures of community feedback:
Good
(Score > 0 or (AnswerCount > 0 and Score = 0)) and !ClosedBad
Score < 0 or ClosedNeutral
Score = 0 and !Closed and AnswerCount = 0
In all cases, Closed excludes duplicate closures because not all duplicates are bad for the site. Duplicate questions are a big part of community frustration, so it feels weird to ignore them. Fortunately, unhelpful duplicates tend to be downvoted as well as closed. When we run tests of features specifically designed to reduce duplicates (such as search improvements), we'll use a metric that takes duplicate closure into account.
Accepted answers aren't useful in this case since we are measuring the community's assessment rather than asker's. This is also a potential reason for excluding duplicate closures as askers have a say in that case.
36% of deletions within the first three days of a questions life are executed by the asker. Beyond that time, most deletions are automatic and intended to remove cruft and not necessarily because questions are bad. We considered counting just community-initiated deletions, but that made question grade calculations noticeably more expensive to calculate. Fortunately, most deleted questions are downvoted or closed, so statistically speaking, deletion adds very little signal.
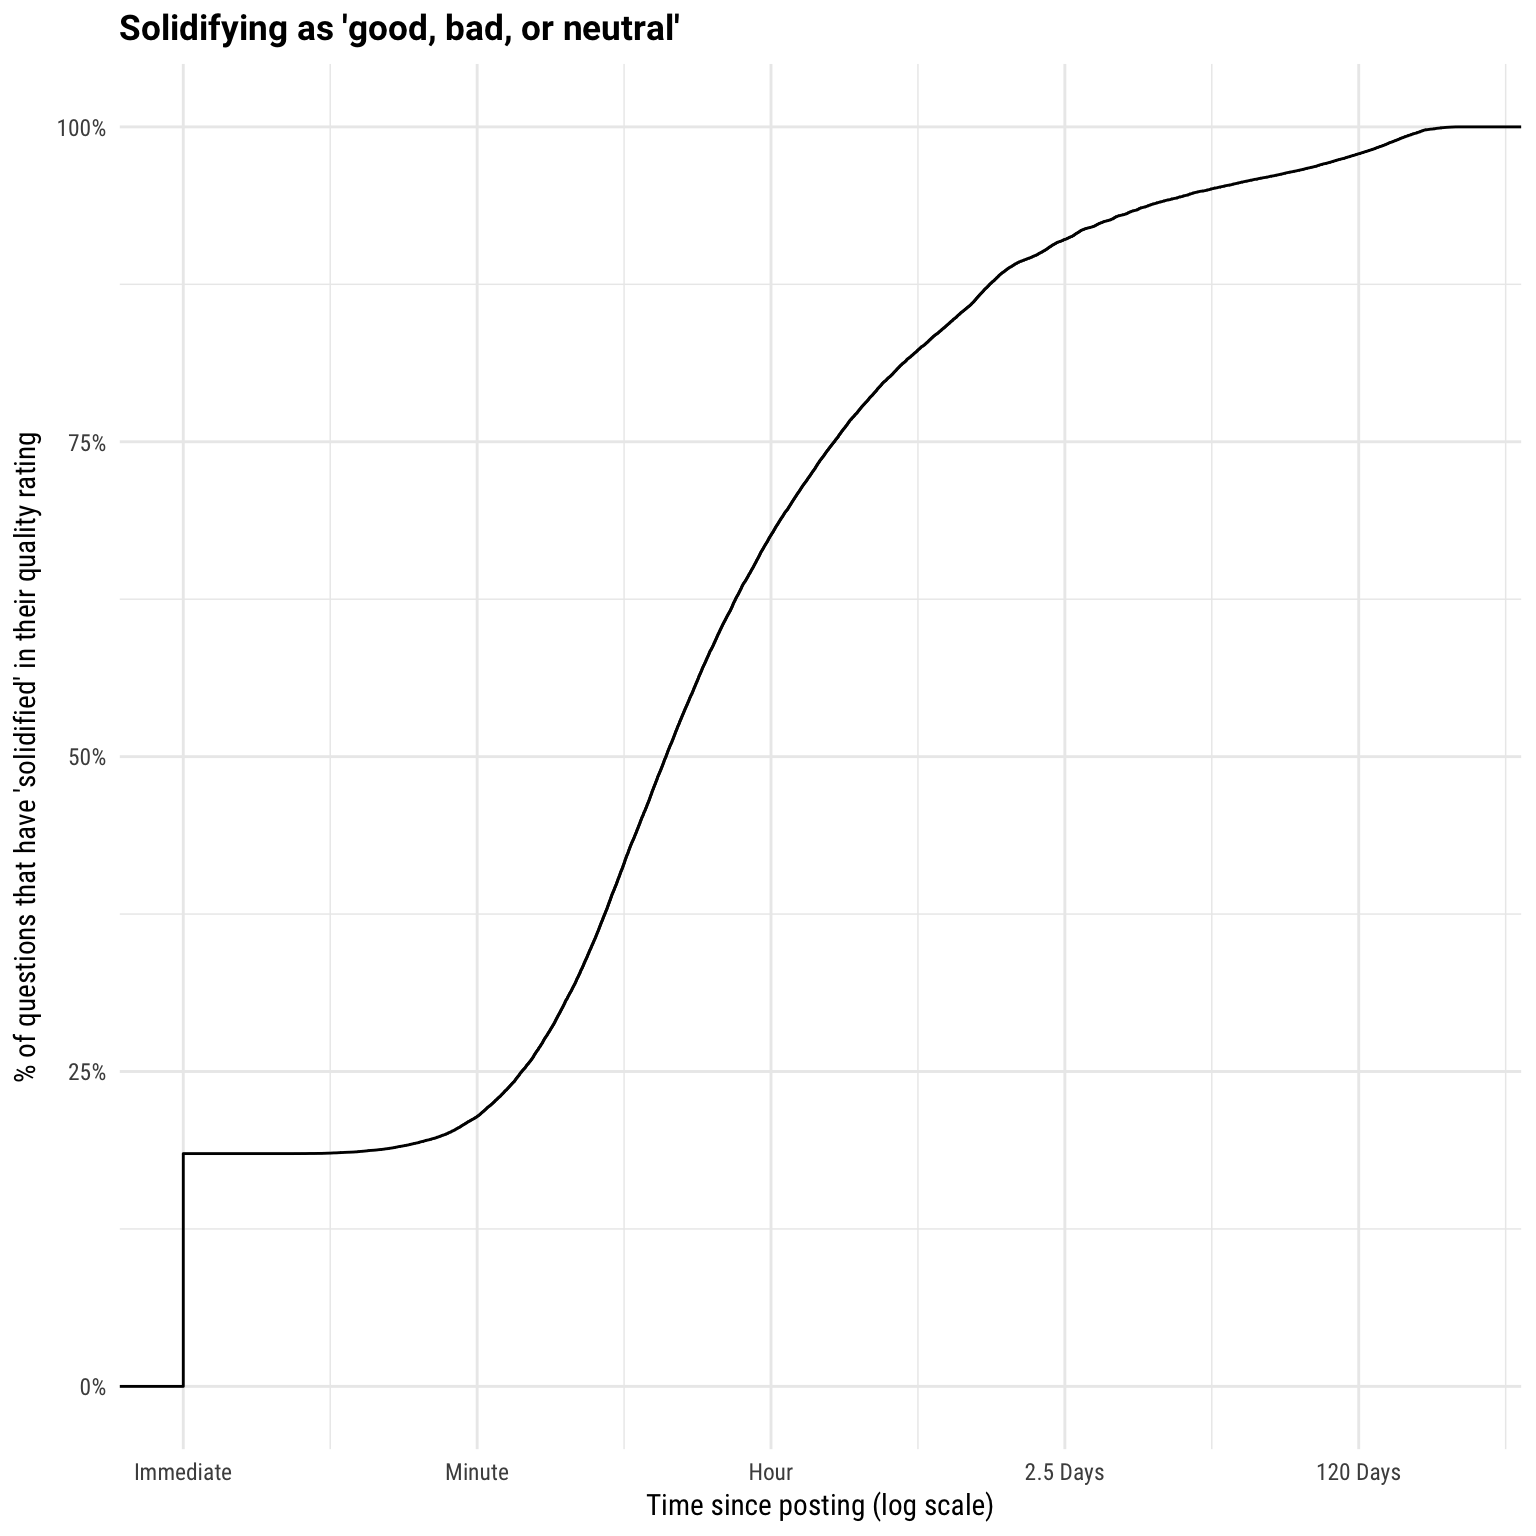
Finally, the grade is calculated after 3 days. Our data team discovered that on Stack Overflow:
- 18.5% of posts never change their status: that is, they’re permanently neutral.
- 67.6% of posts have “solidified” their status in the first hour.
- 91.6% solidify within 3 days.
For the purpose of question quality A/B tests, we're going to consider neutral questions as equivalent to bad questions. Since that divides questions roughly in half on Stack Overflow, tests will resolve more quickly. Our data team also reports that using this criteria, 73% of questions solidify into their good/not-good category within an hour.
Validation of question grades
For the purposes of A/B testing, we need a measure that quickly categorizes all questions. There are certainly going to be edge cases, such as boring questions that happen to get amazing answers or decent questions that are ignored for some reason. To quote Carveth Read:
It is better to be vaguely right than exactly wrong.
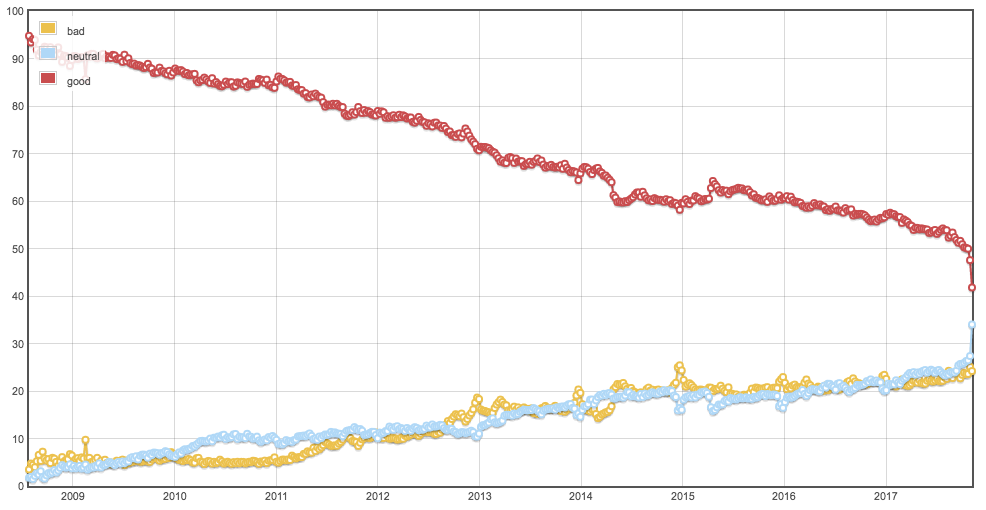
This very simple grading of questions matches the intuition most of us have that as a percentage of all questions, fewer of them are good or even answerable. Look no further than the steady decline of good questions on Stack Overflow:
You can even spot the noticeable dip of 2014 which coincided with the observation that Stack Overflow had become particularly negative. So while this metric is not perfect, it is simple and seems to accurately track the community's evaluation of new questions as they come in. When tackling technical solutions to question quality, we can be confident we're on the right track if there's a statistically meaningful increase in "good" questions as defined above.
If you are interested in how other communities have evaluated their questions over time, you can use this query in the Stack Exchange Data Explorer. There's a very obvious trend of decreasing question grade as sites grow. While our current focus is on Stack Overflow because of its scale and importance to our business, the testing we do there will be useful for all other Stack Exchange sites that grow large enough. That will likely include sites customers pay for. Whether your site has a question quality problem now or will in the future, we'd like to verify that changes we make a positive difference.


Score = 0 and AnswerCount = 1 and SelfAnsweredto fall into the Neutral bucket? That's a question that no-one else has done anything positive with.