20

I just read this blog post about the change in traffic due to the pandemic. It's very interesting and I'm grateful to the people who took the time to write it. However, it only talks about SE sites that have seen an increase in traffic.

So, I'm wondering if some SE sites have seen a drop in traffic due to the pandemic (my guess is yes). Which are those sites?

Also, are there some SE sites that haven't been affected at all?

And if someone could provide a list of all the SE sites and how they have been affected in traffic/participation, that would be very nice.

7

3 Answers 3

20

Yes, Travel.SE greatly. People aren't travelling anymore due to the pandemic. As a result of this, the questions per day have gone down from 19 to 5.3.

A lot of questions are now getting closed due to being offtopic e.g. When can I travel again?

4
  • 1
    I'd have thought the tendency would simply have switched to "can I get reimbursed" questions, but then again all I know of Travel.SE is what HNQ shows me. Nice info to have +1
    – Jenayah
    Commented Apr 21, 2020 at 12:32
  • 2
    @Jenayah we had those questions but not as many now
    – user707129
    Commented Apr 21, 2020 at 12:33
  • 3
    Many of the questions now seem to be 'What do I do now, visa run out' or variations on that. (Seem, I have not counted.)
    – Willeke
    Commented Apr 21, 2020 at 12:45
  • @Jenayah, the flood of "Can I get reimbursed?" questions was a month ago, when the airlines were busy shutting down.
    – Mark
    Commented Apr 24, 2020 at 1:19
12

Thanks to Martin who pointed out this SEDE request by Glorfindel, I was able to make this table:

Colonne1                    % more questions    % more answers
_TOTAL                          3.62%           -5.28%
StackExchange.Health            207.79%         347.92%
StackExchange.Korean            150%            104.76%
StackExchange.Sound             85.19%          6.45%
StackExchange.Homebrew          60%             -39.29%
StackApps                       60%             20%
StackExchange.Skeptics          54.55%          38%
StackOverflow.Br                45.27%          10.72%
StackExchange.Literature        44.74%          -3.08%
StackExchange.Parenting         44.44%          3.13%
StackExchange.Opendata          41.86%          104.35%
StackExchange.Bricks            40%             25.49%
StackExchange.German            34.18%          17.49%
StackExchange.Islam             33.33%          56.34%
StackExchange.Windowsphone      33.33%          0%
StackExchange.Japanese          32.95%          6.64%
StackExchange.Biology           32.02%          24.29%
StackExchange.Gaming            28.93%          7.08%
StackExchange.English           24.25%          18.99%
StackExchange.Tridion           24.24%          -14.29%
StackExchange.Gardening         21.78%          -25.56%
StackExchange.Ubuntu            20.19%          12.11%
StackExchange.3dprinting        19.3%           -28.57%
StackExchange.Puzzling          17.79%          3.24%
StackExchange.Hinduism          17.05%          29.32%
StackExchange.Ebooks            16.67%          28.57%
StackExchange.Economics         16.67%          -0.68%
StackExchange.Iot               16%             -25.81%
StackExchange.GameDev           15.71%          5.51%
StackExchange.Genealogy         14.29%          -18.52%
StackExchange.Judaism           13.44%          4.98%
StackExchange.Stellar           12.5%           8.33%
StackExchange.Sqa               12.37%          3.89%
StackExchange.Reverseengineering 12.2%          10.61%
StackExchange.Movies            11.45%          10.33%
StackExchange.Hardwarerecs      11.32%          62%
StackExchange.Italian           11.11%          7.14%
StackExchange.Wordpress         10.71%          -4.02%
StackExchange.Mathematica       10.67%          15.81%
StackExchange.Quant             10.36%          -6.9%
StackExchange.Audio             10.23%          21.54%
StackExchange.Academia          9.76%           3.45%
StackExchange.Chemistry         9.7%            4.46%
StackExchange.Or                9.26%           25.33%
StackExchange.Mythology         9.09%           -37.04%
StackExchange.Ethereum          8.42%           14.13%
SuperUser                       7.17%           5.22%
StackExchange.Joomla            6.9%            -2.86%
StackExchange.Emacs             6.67%           -15.91%
StackExchange.Scicomp           6.58%           -2.74%
StackExchange.Hermeneutics      6.33%           8.57%
StackExchange.Engineering       6.21%           15.58%
StackExchange.Arduino           6.19%           2.38%
StackExchange.Opensource        5.41%           8.47%
StackExchange.Tex               5.31%           4.45%
StackExchange.Apple             5.15%           -9.4%
StackExchange.Ham               5.13%           17.33%
StackExchange.Bioinformatics    5.1%            -13.93%
StackExchange.Music             4.95%           1.46%
StackOverflow.Ru                4.83%           0.86%
StackExchange.Portuguese        4.76%           18.52%
StackOverflow.Es                4.48%           -10.49%
StackExchange.Russian           4.35%           0%
StackExchange.Money             4.29%           3.69%
StackOverflow                   4.29%           -5.65%
StackExchange.Martialarts       4.17%           31.82%
StackExchange.Blender           3.79%           -4.76%
StackExchange.Unix              3.75%           -2.32%
StackExchange.Salesforce        3.51%           -4.7%
StackExchange.Math              2.75%           0.81%
StackExchange.Crypto            2.6%            5.09%
StackExchange.Tor               2.56%           -17.95%
ServerFault                     2.3%            -10.44%
StackExchange.Ell               2.2%            13.58%
StackExchange.Cstheory          2.08%           -22.73%
StackExchange.Electronics       1.78%           -1.83%
StackExchange.Vi                1.57%           -1.96%
StackExchange.Networkengineering 1.56%          -8.16%
StackOverflow.Ja                0.6%            -5.06%
StackExchange.Scifi             0%              -13.85%
StackExchange.Cseducators       0%              7.14%
StackExchange.Buddhism          0%              -24.41%
StackExchange.Hsm               0%              -5.13%
StackExchange.Linguistics       0%              -1.56%
StackExchange.Gis               -0.07%          -10.6%
StackExchange.WebApps           -1.03%          0.94%
StackExchange.Christianity      -1.19%          -10.93%
StackExchange.Bitcoin           -1.48%          2.07%
StackExchange.Physics           -1.53%          -3.11%
StackExchange.Stats             -1.74%          -15.18%
StackExchange.Mathoverflow      -1.98%          -3.15%
StackExchange.Dsp               -2.26%          23.2%
StackExchange.Datascience       -2.34%          -6.37%
StackExchange.Android           -3.58%          -17.82%
StackExchange.Chess             -3.74%          -31.36%
StackExchange.Raspberrypi       -3.77%          0.27%
StackExchange.Politics          -4.32%          20.72%
StackExchange.Sharepoint        -4.67%          -6.69%
StackExchange.Pm                -5.26%          3.7%
StackExchange.Softwarerecs      -5.53%          12.38%
StackExchange.Latin             -5.77%          55.1%
StackExchange.Robotics          -6.15%          -50.88%
StackExchange.Drupal            -6.29%          -18.02%
StackExchange.Musicfans         -6.45%          -15.15%
StackExchange.Diy               -6.63%          9.74%
StackExchange.Dba               -6.67%          -13.83%
StackExchange.Security          -7.42%          -18.8%
StackExchange.Pets              -7.58%          -19.35%
StackExchange.Poker             -7.69%          -14.29%
StackExchange.Civicrm           -9.21%          -29.69%
StackExchange.Cooking           -9.22%          -2.6%
StackExchange.Quantumcomputing  -10.69%         -11.92%
StackExchange.Cs                -10.82%         -11.97%
StackExchange.Programmers       -10.91%         -25.49%
StackExchange.Magento           -11.68%         -19.35%
StackExchange.Elementaryos      -11.73%         -13.83%
StackExchange.Devops            -12.3%          -12.62%
StackExchange.Sports            -12.5%          -41.94%
StackExchange.Ukrainian         -12.5%          -6.25%
StackExchange.Chinese           -12.94%         2.02%
StackExchange.French            -13.16%         -15.86%
StackExchange.Bicycles          -13.27%         -20.29%
StackExchange.Codegolf          -14.29%         -8.45%
StackExchange.Fitness           -15%            -22.06%
StackExchange.Codereview        -15.12%         -21.67%
StackExchange.Photography       -15.25%         -12.88%
StackExchange.Law               -15.95%         -11.31%
StackExchange.Rpg               -16.15%         -17.65%
StackExchange.Graphicdesign     -16.47%         -14.97%
StackExchange.Philosophy        -16.88%         -15.25%
StackExchange.Anime             -17.02%         -4.94%
StackExchange.Sitecore          -17.61%         -22.02%
StackExchange.Expatriates       -18.06%         -29.69%
StackExchange.Ux                -18.12%         -22.59%
StackExchange.Webmasters        -18.75%         -28.14%
StackExchange.History           -18.9%          -7.56%
StackExchange.Ai                -19.62%         13.07%
StackExchange.Workplace         -20.97%         -24.65%
StackExchange.Sustainability    -22.22%         -43.18%
StackExchange.Writers           -22.47%         -23.58%
StackExchange.Lifehacks         -22.73%         -7.41%
StackExchange.Worldbuilding     -23.51%         -19.33%
StackExchange.Space             -24.37%         -12.66%
StackExchange.Astronomy         -25.17%         -45.16%
StackExchange.Craftcms          -25.58%         -17.35%
StackExchange.Retrocomputing    -26.88%         -41.3%
StackExchange.Earthscience      -27.08%         -29.57%
StackExchange.Garage            -27.41%         -43.75%
StackExchange.Aviation          -27.54%         -38.21%
StackExchange.Woodworking       -27.59%         -26.83%
StackExchange.Coffee            -28.57%         -44.44%
StackExchange.Iota              -28.57%         -20%
StackExchange.Travel            -29.35%         -26.57%
StackExchange.Boardgames        -30%            -20.71%
StackExchange.Matheducators     -30.3%          -33.33%
StackExchange.Freelancing       -33.33%         23.53%
StackExchange.Cogsci            -33.33%         -35%
StackExchange.Spanish           -36%            -42.45%
StackExchange.Beer              -36.36%         -77.27%
StackExchange.Monero            -36.36%         -25.93%
StackExchange.Eosio             -36.84%         -47.22%
StackExchange.Languagelearning  -40%            -62.5%
StackExchange.Expressionengine  -41.18%         -27.27%
StackExchange.Crafts            -41.18%         -18.42%
StackExchange.Tezos             -41.33%         -45%
StackExchange.Rus               -46.67%         -59.48%
StackExchange.Computergraphics  -46.67%         -46.43%
StackExchange.Patents           -47.83%         -67.65%
StackExchange.Esperanto         -52.94%         -28.57%
StackExchange.Outdoors          -56%            -59.38%
StackExchange.Interpersonal     -56.82%         -48.75%
StackExchange.Conlang           -57.14%         -56.25%
StackExchange.Vegetarian        -60%                100%
StackExchange.Moderators        -71.43%         -54.55%

This table shows the difference between questions asked (and answers) between February and March of this years (2020).

We don't see the difference in traffic, but we can see that, as a whole, the SE network had an increase of +3.62% of questions. Though, in the same time, we also see a decrease of 5.28% answers. So people tend to ask more questions but answer less.

12
  • 1
    Heh, I just read this question and thought: I have a SEDE query somewhere which is able to answer this :)
    – Glorfindel Mod
    Commented Apr 22, 2020 at 11:21
  • @Glorfindel Yeah, your SEDE query is very usefull. Though, if you want to write one showing the traffic and post it here, I would be very happy to upvote it. Commented Apr 22, 2020 at 12:51
  • Traffic is hard to obtain via SEDE, since it only stores the current total # of views on a question.
    – Glorfindel Mod
    Commented Apr 22, 2020 at 12:53
  • Arf, that's a bit of a shame, IMO. Commented Apr 22, 2020 at 12:54
  • Worldbuilding (and others) may be due to the loss of one of our moderators (now all but one) and the fall out from that - that's why I'm gone - more than the pandemic. (I know I'm actually building more RPGs and worlds right now by a large margin but still not enough to go back) Commented Apr 22, 2020 at 23:21
  • @LinkBerest I'm not sure I understand. Why would the lost of one moderator leads to less questions ask and answer? Commented Apr 23, 2020 at 6:07
  • When that moderator was the one that helped build it and lead to a bunch of "I Support M...." being added to people's names (or more generally some sites saw a much greater fallout from the impact of all the things that happened from M's firing to CM's firing and many of the lost answers seem to be a continuation of this trend). An interesting questions is did the start of the Corvid quarantines see a change in the loss of answers (i.e. did it effect the rate of loss) but a quick look at the graphs (using original query) I don't think that is the case Commented Apr 23, 2020 at 18:40
  • @LinkBerest The numbers are comparing February and March of this year. The "M..things" was mostely over by then. So I don't see why it would affect the numbers Commented Apr 25, 2020 at 11:28
  • First, this is not a network-wide statement, but a for certain sites statement (like writing would have taken even more of a hit from what I remember of the data). In regards to dates, one of the last of our moderators stepped down because of all that on March 31st (which would also indicate a slow down in moderating activities before that). So again, it is something that as a data professional I would have to consider because the fallout is not done. Commented Apr 26, 2020 at 2:31
  • With answers, just the fact that there was a fallout at all which has not been ended by some. When top answers leave or reduce their activity, it will certainly change the typical trends with regard to answering leaving the question "by how much?" On sites like writing and worldbuilding which one would predict an increase in activity but instead see a drop - its something to look at. The drop in questioning - is a separate but also interesting question which may or may not have been effected (personally I was expecting more but less quality but it seems not getting answers is causing a drop) Commented Apr 26, 2020 at 2:42
  • @LinkBerest-GoodbyeSE Thanks for the answer. I did not know all that. It's too bad we don't have the number of view per site. I think it would be more significant in showing the effect of the pandemic than the number of questions asked and answered. Commented Apr 26, 2020 at 17:56
  • Yeah, even with the analytic privilege this would only help determine traffic change (I deleted the account which had access to it so cannot look at that CSV and I remember the data being sampled so not 100% accurate). Determine why people who answered questions have stopped would take an investment from the company to reach out to them (with standard research methods) and as all their meta/blog posts seem to be "let's just forgive and forget" over "lets learn from this" I don't see that happening. Commented Apr 26, 2020 at 21:19
12

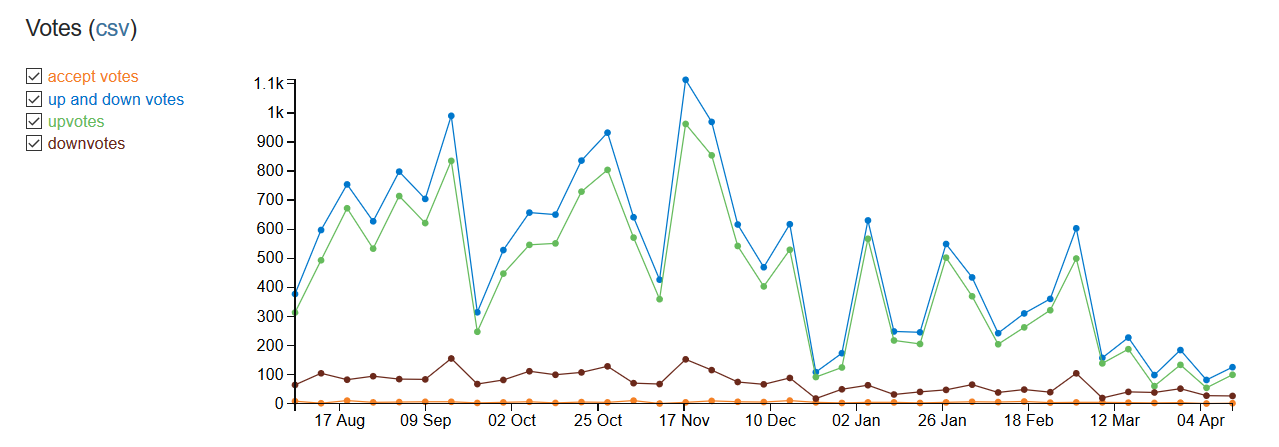
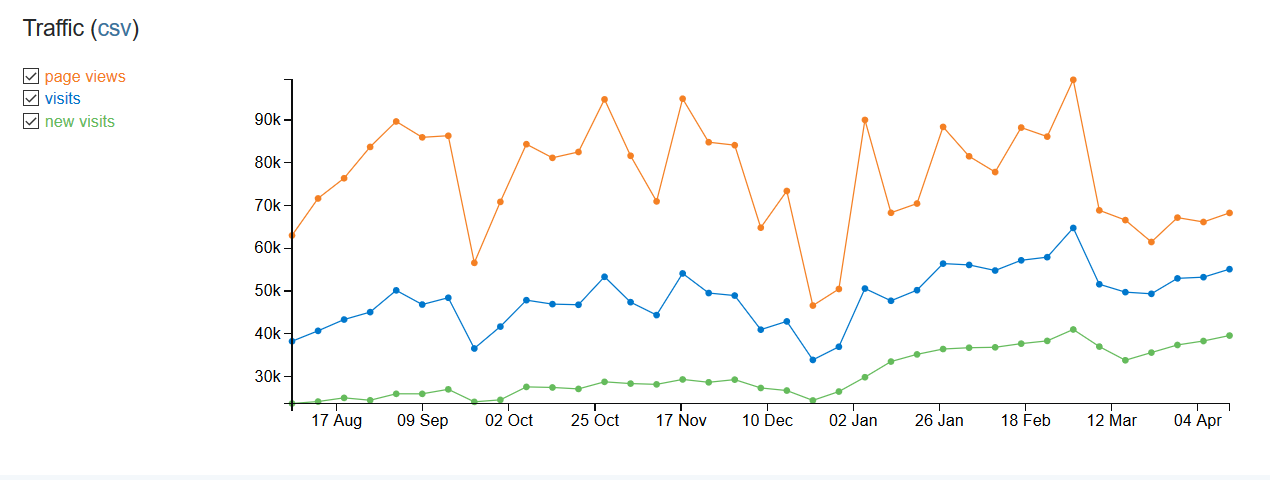
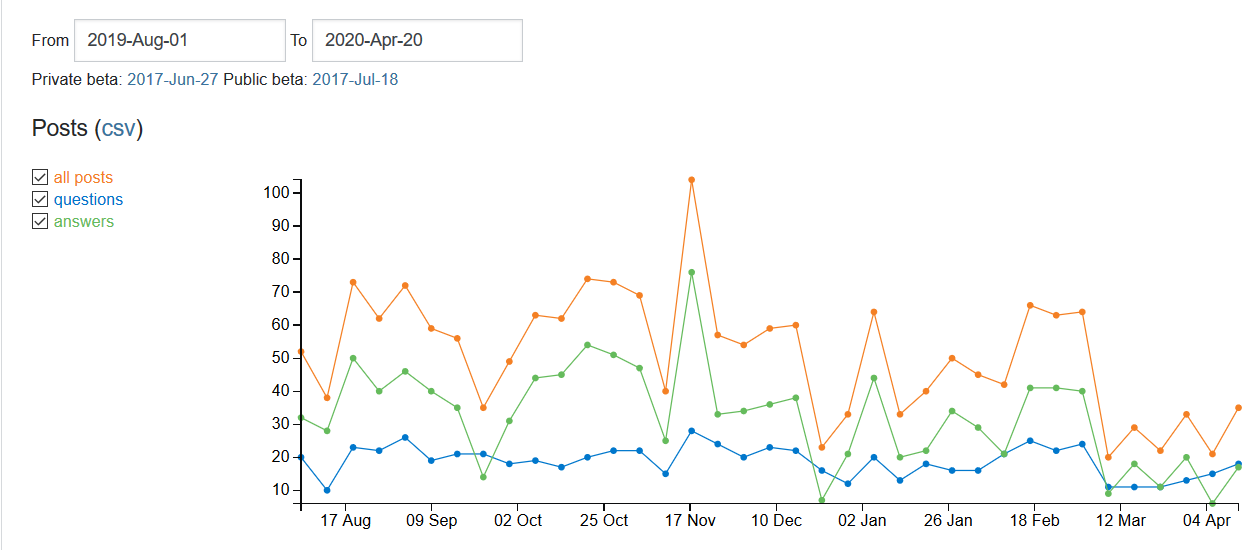
I happen to be an active user on Interpersonal Skills and we did see an important drop in traffic (I guess people don't have as much interpersonal interaction as they use to).

Here are the data:

Posts

Votes

Traffic

As you can see, somewhere between the 2nd and the 9th of March 2020, people stop visiting and interacting.

You must log in to answer this question.

Not the answer you're looking for? Browse other questions tagged .