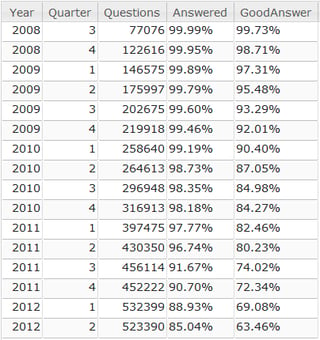
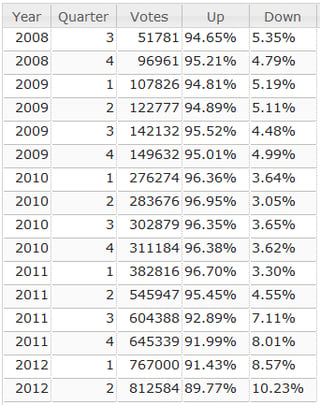
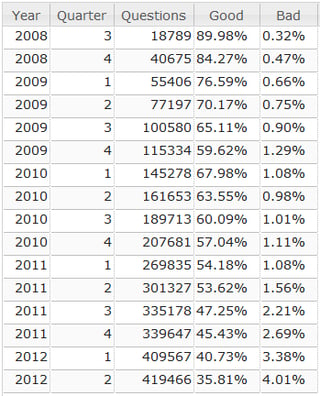
Updated to include the last two quarters of 2012.
I think what's most interesting about the update is how the numbers have changed over time. For instance, when I originally answered this question quarter 1, 2012, was complete. There were 409,490 undeleted, open, questions that quarter of which 85.61% were answered and 70.71% answered "well". Those numbers today are 405,131 questions, 87.47% answered and 74.30% answered "well", which implies that as time goes by the Stack Overflow community is doing something about the older answered questions, just not very much. The increase in the number of questions with a score of 1 or more also indicates that SO users are upvoting (viewing/using?) older questions, which is good.
The extremely noticeable consistency between the current and previous results is the fact that all these downward trends have continued, things are getting worse. On current trends, quarter 3 2013 will have less than 50% of questions where an answer is either upvoted or accepted. If the trend in answering/deleting older questions continues then it'll be rescued later but the same will happen again, permanently, around quarter 1 2014.
This is a "problem" that needs to be fixed, somehow.
I know this isn't an answer but it's far too long for a comment. There's a problem with your SQL, caused by the LEFT OUTER JOIN; you're counting questions multiple times so the problem is both slightly better and slightly worse than what you think.
I also disagree with your definition of a "good" answer. By definition an accepted answer is "good" as it has helped the OP (unless of course they've been pushed into accepting it by loads of comments but that's another matter). I've excluded Community owned questions and answers as I don't really think they are relevant (and it helps the query to work!).
Your first set of results on the number of open questions by quarter now returns the following:
Year Quarter Questions Answered GoodAnswer
---- ------- --------- -------- ----------
2008 3       17508     99.99%   99.83%
2008 4       38790     99.87%   98.11%
2009 1       53441     99.73%   96.23%
2009 2       75339     99.56%   94.24%
2009 3       98426     99.22%   92.49%
2009 4       113136    99.02%   91.72%
2010 1       142909    98.62%   90.76%
2010 2       159213    98.01%   88.50%
2010 3       187222    97.56%   87.32%
2010 4       205903    97.41%   86.87%
2011 1       267895    96.98%   85.83%
2011 2       298140    96.16%   84.30%
2011 3       312239    95.30%   82.52%
2011 4       316593    94.46%   81.55%
2012 1       405131    87.47%   74.30%
2012 2       431420    85.41%   71.38%
2012 3       452507    83.44%   68.07%
2012 4       461118    80.62%   64.02%
As you can see the percentage of answered questions is a little worse than you thought, but the percentage of questions with a "good" answer is a little better. Personally I think the telling point here is not necessarily the number of questions but where the differences lie between my results and your own. For Q4 2008 you have 122,616 and I've got 39,557 questions, which implies that every question received over 3 answers. For Q2 2012 the difference is minimal, on average questions receiving about 1.2 answers.
I've also run this for questions with a score >= 0:
2008 3       17454     99.99%   99.84%
2008 4       38618     99.87%   98.13%
2009 1       53133     99.73%   96.24%
2009 2       74795     99.55%   94.26%
2009 3       97569     99.22%   92.52%
2009 4       111776    99.01%   91.77%
2010 1       141491    98.60%   90.82%
2010 2       157757    98.00%   88.54%
2010 3       185404    97.54%   87.34%
2010 4       203733    97.38%   86.91%
2011 1       265103    96.95%   85.88%
2011 2       293660    96.11%   84.35%
2011 3       305355    95.20%   82.55%
2011 4       308130    94.31%   81.54%
2012 1       392376    87.07%   74.14%
2012 2       417341    84.92%   71.18%
2012 3       436875    82.85%   67.81%
2012 4       443642    80.31%   64.00%
I think the surprise here is how little difference it makes. It reflects well on Stack Overflow that no matter if the question is not as good as it could be you are just as likely to get a "good" answer. Obviously, closed questions would skew this massively and as a number of "poor" questions get closed not too much can be read into this.
Lastly, here the same query is for questions with a score >= 1:
Year Quarter Questions Answered GoodAnswer
---- ------- --------- -------- ----------
2008 3       15797     99.99%   99.88%
2008 4       32945     99.90%   98.87%
2009 1       41381     99.74%   98.18%
2009 2       53922     99.63%   97.38%
2009 3       65645     99.53%   96.71%
2009 4       69626     99.35%   95.97%
2010 1       99493     99.02%   94.66%
2010 2       104134    98.50%   93.04%
2010 3       116514    98.10%   92.16%
2010 4       122588    98.00%   91.82%
2011 1       152765    97.79%   91.31%
2011 2       169152    96.96%   89.90%
2011 3       167683    95.92%   88.18%
2011 4       165138    94.92%   86.80%
2012 1       183482    93.92%   85.34%
2012 2       180243    92.93%   83.66%
2012 3       173618    91.26%   80.88%
2012 4       188466    87.52%   74.33%
As you can see the number of answered questions and the number of questions answered "well" significantly improves though the same drop-off is observable.
My own conclusion from these statistics is that a finesse to the system to remove unanswered questions, or whatever it might be, is not what is required. The number of answered "good" questions at over 91% is, in my opinion, a pretty high number.
What seems to be needed is an increase in the number of people who answer questions. Whilst Stack Overflow has had an ever increasing number of people asking questions there hasn't been a commensurate increase in the number of people answering them.
I ran a little query to test this hypothesis:
Year Quarter Questioning Answering
---- ------- ----------- ---------
2008 3       6411        9007
2008 4       10724       13276
2009 1       13713       15995
2009 2       18929       21276
2009 3       24474       25631
2009 4       37388       36124
2010 1       47454       41411
2010 2       56895       46868
2010 3       66340       52398
2010 4       73162       59578
2011 1       95347       74931
2011 2       108828      78798
2011 3       118150      85501
2011 4       117156      89839
2012 1       151337      107792
2012 2       167394      116139
2012 3       182767      125379
2012 4       201461      133558
As you can see in the "early" days the number of users answering questions was more than the number of people asking them. This has now been completely reversed and the questioners are in the ascendant.
What the solution is, I'm not entirely sure. What seems certain though is that Stack Overflow needs to find a way of converting question askers into question answerers. Without flooding the place with crap answers.


