10

Is it possible to view a graph showing a post's up and down votes over time?

Not who voted for it, just "vote received at [timestamp]". I know if a user has enough rep they can see the total up and down votes their post has received so far, but I'm not aware of being able to see the history of votes on a post.

7
  • 2
    You can see a daily log of votes at the post's timeline (/posts/[post ID]/timeline). Commented Dec 28, 2019 at 3:07
  • @SonictheAnonymousHedgehog I don't know why you didn't make that an answer as that was exactly what I was after! Edit: actually, it doesn't show all votes, but an aggregate, but it's close enough!
    – Cool Fool
    Commented Dec 28, 2019 at 3:10
  • Well... it’s not quite what you want. It’s not time stamped per vote. It’s a daily digest of the score changing.
    – Catija StaffMod
    Commented Dec 28, 2019 at 3:12
  • Hmm, I see. I was interpreting votes on answers as votes on the question. I was hoping for more granularity than a day.
    – Cool Fool
    Commented Dec 28, 2019 at 3:15
  • 3
    If I remember correctly, not even mods see that. Sorry.
    – Catija StaffMod
    Commented Dec 28, 2019 at 3:17
  • Yeah, since it doesn't provide specific timestamps, I kept it as a comment rather than an answer. Commented Dec 28, 2019 at 5:27
  • You can also do that with the help of some JavaScript and the SE API. However, there's no graph and things are more complicated with this method. Commented Dec 28, 2019 at 12:57

2 Answers 2

6

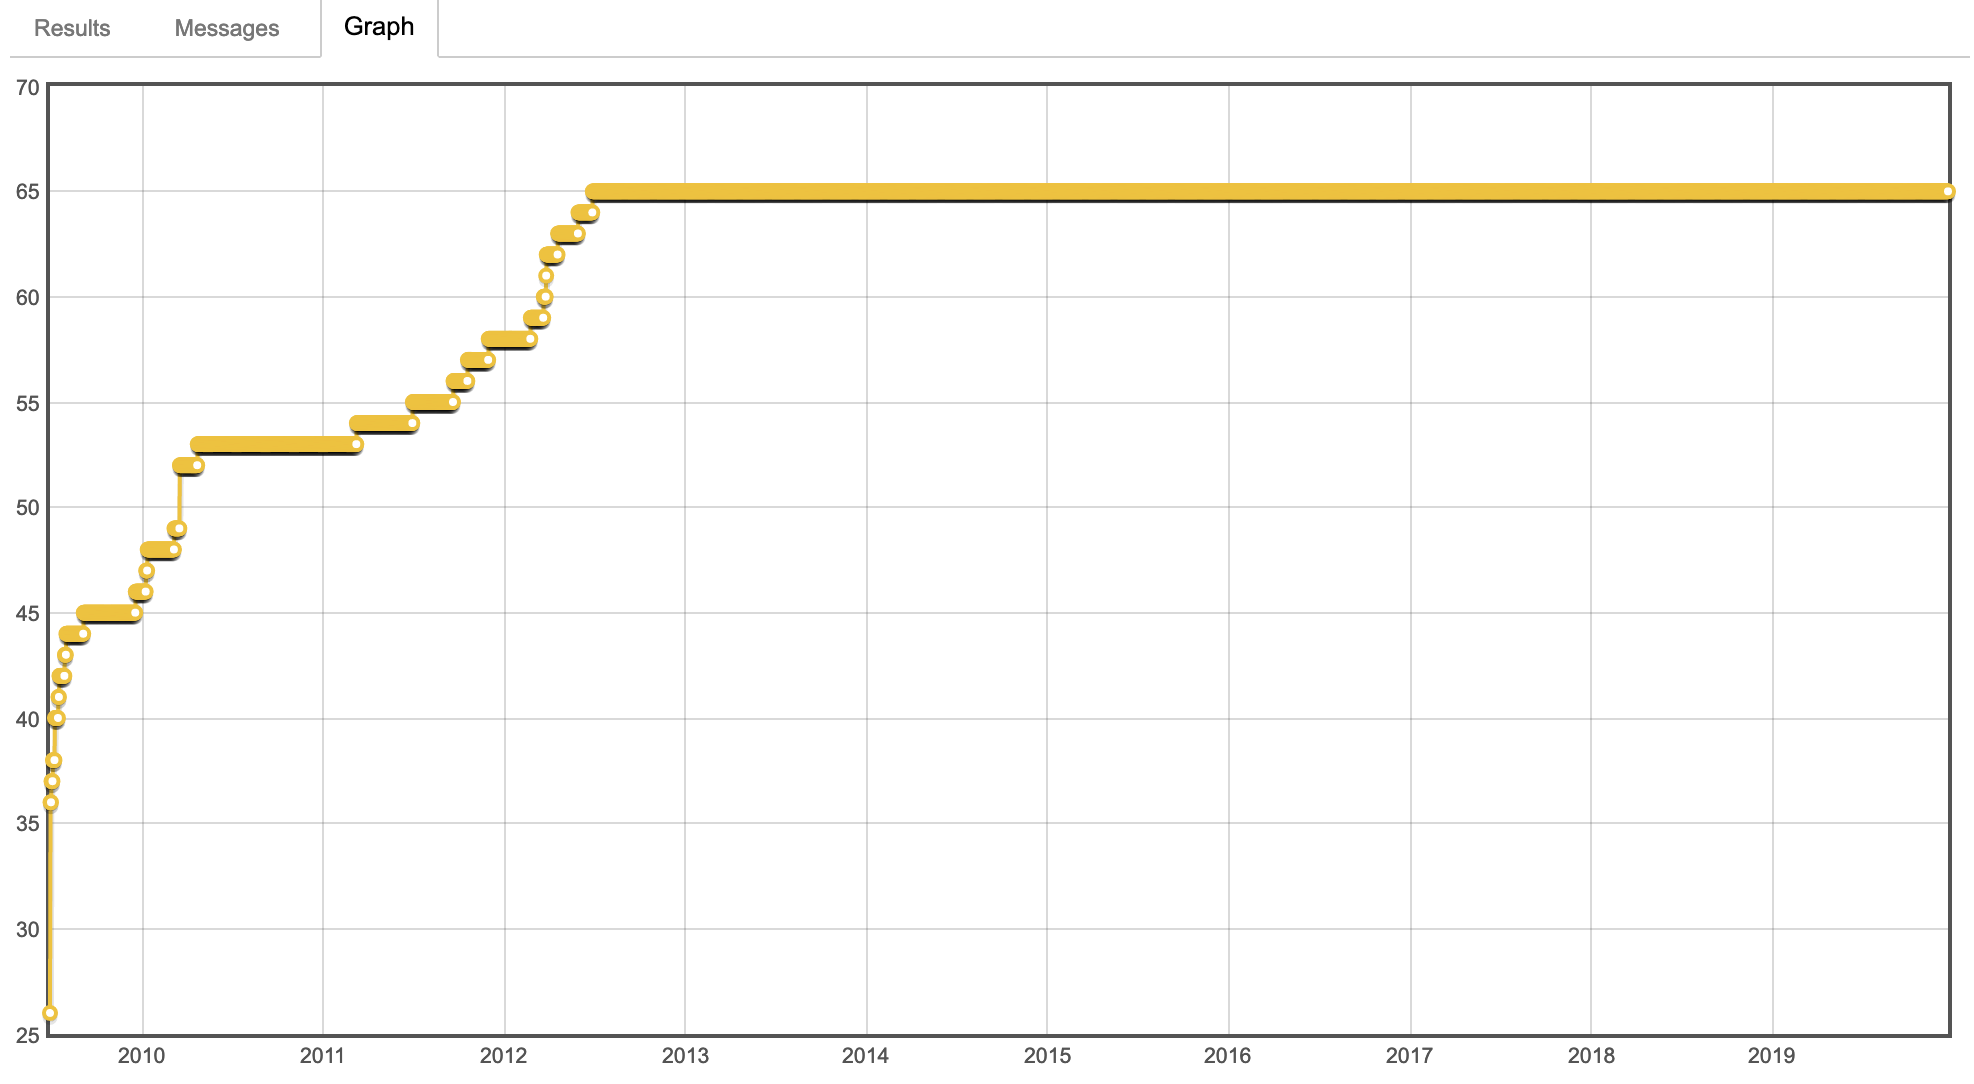
You want a graph, you get a graph. It's holiday season after all:

enter image description here

As you noticed, vote timestamps are missing time information, and data may be (up to) 7 days old since SEDE is refreshed once a week on Sunday morning. Notice the use of parameters to reuse the query for multiple posts. Editing them repeatedly gets rather tedious :)

2
  • I have no idea how you got "Graph" to magically come up but it's very cool!
    – Cool Fool
    Commented Dec 28, 2019 at 10:39
  • 1
    @CoolFool Graphs are generated automatically depending on the output of a query: data.stackexchange.com/help#graphing
    – Glorfindel Mod
    Commented Dec 28, 2019 at 10:45
5

There is a tool called Stack Exchange Data Explorer that allows users to perform queries on Stack Exchange's databases. Although it's not graphical, the raw data can be used to create a graph.

For instance, to view the voting history of the first ever Meta Stack Exchange question go to https://data.stackexchange.com/meta.stackexchange/query/new and run the below query:

SELECT v.Id
      ,v.PostId
      ,vt.Name as VoteType
      ,v.UserId
      ,v.CreationDate
      ,v.BountyAmount
FROM Votes v
JOIN VoteTypes vt
  ON vt.id = v.VoteTypeId
WHERE PostId = 1
ORDER BY CreationDate

Output:

Id | PostId | VoteType | UserId | CreationDate        | BountyAmount
---+--------+----------+--------+---------------------+-------------
 2 |      1 | UpMod    |        | 2009-06-28 00:00:00 |
 4 |      1 | UpMod    |        | 2009-06-28 00:00:00 |
 5 |      1 | UpMod    |        | 2009-06-28 00:00:00 |
 7 |      1 | UpMod    |        | 2009-06-28 00:00:00 |
 8 |      1 | Favorite |  84671 | 2009-06-28 00:00:00 |
.
.
.

The timestamps are all at midnight of that day, and the data is not available until about 7 days have passed. For the votes on this question, replace WHERE PostId = 1 with WHERE PostId = 341195.

You must log in to answer this question.

Not the answer you're looking for? Browse other questions tagged .