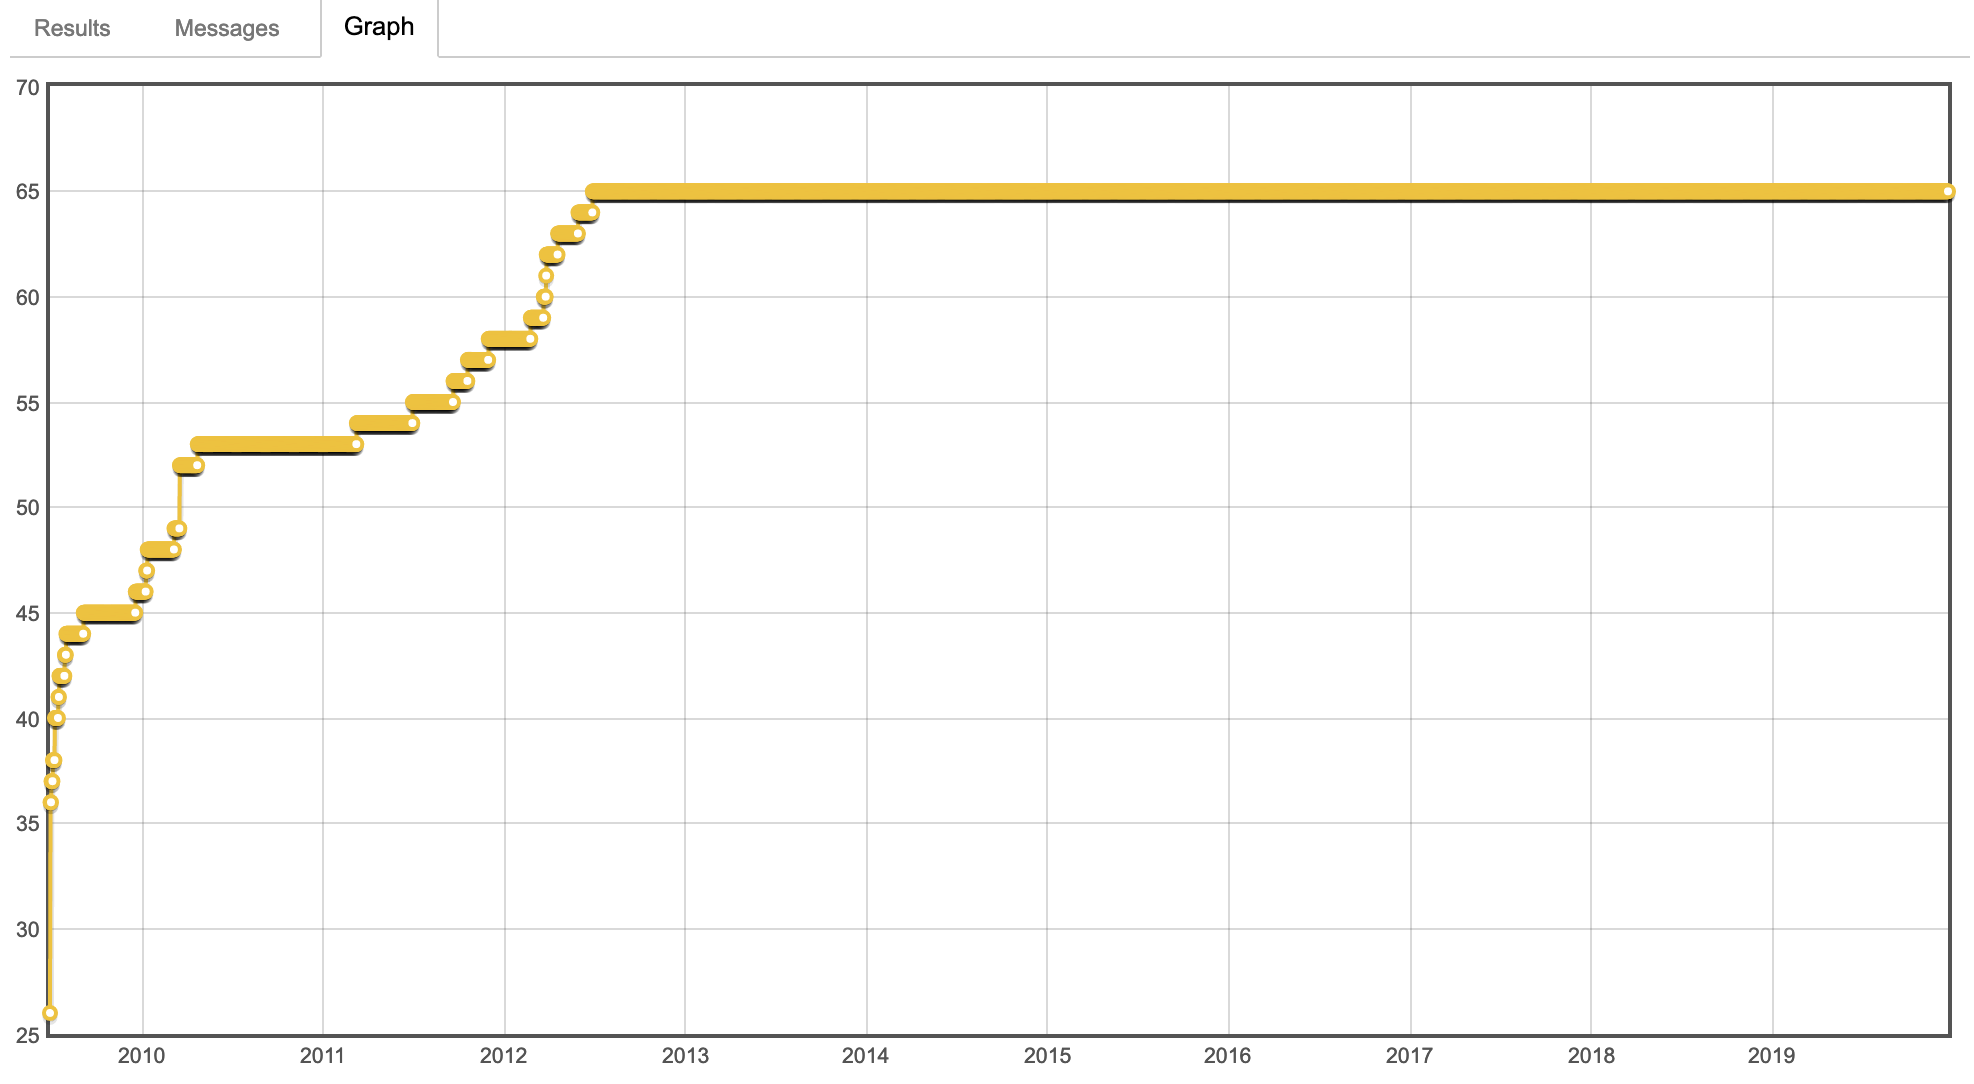
There is a tool called Stack Exchange Data Explorer that allows users to perform queries on Stack Exchange's databases. Although it's not graphical, the raw data can be used to create a graph.
For instance, to view the voting history of the first ever Meta Stack Exchange question go to https://data.stackexchange.com/meta.stackexchange/query/new and run the below query:
SELECT v.Id
      ,v.PostId
      ,vt.Name as VoteType
      ,v.UserId
      ,v.CreationDate
      ,v.BountyAmount
FROM Votes v
JOIN VoteTypes vt
  ON vt.id = v.VoteTypeId
WHERE PostId = 1
ORDER BY CreationDate
Output:
Id | PostId | VoteType | UserId | CreationDate        | BountyAmount
---+--------+----------+--------+---------------------+-------------
 2 |      1 | UpMod    |        | 2009-06-28 00:00:00 |
 4 |      1 | UpMod    |        | 2009-06-28 00:00:00 |
 5 |      1 | UpMod    |        | 2009-06-28 00:00:00 |
 7 |      1 | UpMod    |        | 2009-06-28 00:00:00 |
 8 |      1 | Favorite |  84671 | 2009-06-28 00:00:00 |
.
.
.
The timestamps are all at midnight of that day, and the data is not available until about 7 days have passed. For the votes on this question, replace WHERE PostId = 1 with WHERE PostId = 341195.


/posts/[post ID]/timeline).