78

Many Meta users have asked for statistics that involve data that isn't available through the public data dumps (especially voting-related stats).

In conjunction with the SE team, I will be bringing the community these statistics!

I've have been granted access to all the relevant public and private data on the network, so a complete and in-depth data analysis can be presented to the community.

First, I need your help -- which sets of statistics would you like to see?


How this is going to work:

  • Please post one idea for a statistic (or a very closely related set of statistics) per answer

  • Stats won't be run for any single account: the idea is to reveal community/network patterns

  • Like the public data dumps, I can't reveal any personally-identifiable information (and the SE staff has the last word on any of the stats being presented, or not)

Note that the statistics don't have to involve private data (if possible, I will provide equivalent SEDE queries).

Also, it would be nice if each statistic could be presentable on a graph for easier consumption (i.e., for a blog post), but this isn't required.

I'll tackle the most popular/interesting requests, so please vote for the stats you'd like to see!


For those who made suggestions for statistics based on question views, I have bad news, unfortunately: Jeff informed me that detailed view data is not stored in the database. Although these stats won't be presented, thank you very much for your suggestions!

4
  • 22
    just a little clarification -- Jon signed an NDA with us, so he has access to the stuff a community moderator would, but nothing like email addresses, etc. Commented May 5, 2011 at 5:32
  • 1
    Related, for those who like statistics: the public Quantcast statistics. Not very specific though.
    – Arjan
    Commented Aug 24, 2011 at 18:55
  • @JonSeigel Have these statistical graphs/analysis been posted somewhere yet, or are they still in the making?
    – n00b
    Commented Nov 19, 2012 at 16:47
  • @droid: For the questions I answered, they are linked in the answers below.
    – Jon Seigel
    Commented Nov 19, 2012 at 17:12

30 Answers 30

40
+50

I think it would be interesting to see what percentage of questions are migrated to another site and subsequently closed on the target site. This might need to be split by close reason on the target site because how I see it, closed as duplicate is an acceptable close reason but the other close reasons are "bad" ones and possibly indicate the question shouldn't have been migrated.

On Server Fault it certainly seems like we close a fair amount of questions coming from other sites for one of the "bad" reasons, but I don't know if I'm exaggerating the problem in my head or if an actual problem exists.

6
  • 10
    It would be good so see how quickly they are killed too.
    – user147520
    Commented May 7, 2011 at 20:00
  • I've noticed some issues with moving questions recently with all the added stack exchange sites. It has more to do with overly strict "off-topic" rules.
    – WalterJ89
    Commented May 12, 2011 at 6:04
  • I've got this one finished -- unfortunately I can't give a SEDE query for this because it requires deleted post data. I only have SF and SU data on my local machine, and I can tell you that for SU -> SF, less than 7% of all migrated questions on that path get closed (for any reason) after migration. SO -> SF may be a different story. I'm working on getting full results now.
    – Jon Seigel
    Commented Jun 4, 2011 at 19:32
  • ...oops. Forgot a WHERE condition. That number is actually 3%, and SF -> SU is 5%.
    – Jon Seigel
    Commented Jun 5, 2011 at 4:29
  • 1
    FYI: The full results of this request initiated this: meta.stackexchange.com/questions/89242/…
    – Jon Seigel
    Commented Jul 9, 2011 at 16:53
  • Results posted here.
    – Jon Seigel
    Commented Apr 29, 2012 at 15:17
29
+50

This isn't private data so it can probably be done with a SEDE query, but I'd like to see some statistics around tags and Unanswered questions. In particular, I'd like to see which tags have the highest numbers and highest proportions of Unanswered questions.

Related to that, there are certain tags like that are used in conjunction with many different tags often enough that it would be interesting to see what impact it has on Unanswered questions. For example, which + combination has the highest proportion of Unanswered questions?

15
  • 2
    Sneak preview for the first part (feedback wanted).
    – Jon Seigel
    Commented Jun 1, 2011 at 2:20
  • @Jon: That looks fantastic, exactly the kind of stats I was hoping to see. I'm a little surprised at how high some of the unanswered percentages are. Hopefully letting people know where attention is needed will help us get our overall answered percentage up. Commented Jun 1, 2011 at 2:38
  • Thanks -- any feedback/suggestions for the ordering of the results? I tried to emulate an "importance" score.
    – Jon Seigel
    Commented Jun 1, 2011 at 3:01
  • @Jon: It's hard to say if unanswered % or total unanswered is more important, so combining them is a good idea. I ran it ordered by (UnansweredCount * UnansweredPct) DESC and the results look similar to your weighting score. data.stackexchange.com/stackoverflow/q/101732/… Commented Jun 1, 2011 at 3:19
  • Looking at C#, which I classify as "not an issue", as a benchmark, in both weightings it appears near the top because there are so many questions unanswered. I guess I'll have to play with the ordering function a bit. Let me know if you come up with something better. Thanks for your help!
    – Jon Seigel
    Commented Jun 1, 2011 at 3:27
  • @Jon: I agree, C# does kind of stick out due to the huge number of questions asked. I'll let you know if I think of anything. Thanks a lot for doing this! Commented Jun 1, 2011 at 3:29
  • (UnansweredCount / UnansweredPctRank) DESC seems to do the trick, more or less -- results are at the same link as my first comment.
    – Jon Seigel
    Commented Jun 5, 2011 at 14:44
  • Thanks @Jon, that looks great. Time to roll up my sleeves and figure out what the heck is going wrong in the android tag. Commented Jun 5, 2011 at 14:59
  • Working on part 2, here's a precursor query that just shows the different tag combinations (i.e., all questions, not just unanswered).
    – Jon Seigel
    Commented Jun 5, 2011 at 16:00
  • And part 2 completed -- that query is so heavy I can only run it for the top 15 tags on SEDE.
    – Jon Seigel
    Commented Jun 5, 2011 at 16:47
  • @Jon: Based on the current number of unanswered android questions, I'm reasonably sure that your query is not counting closed questions, but I can't figure out how from reading the SQL. Can you explain how closed questions are not being counted? Other SEDE queries are using ClosedDate is null. Commented Aug 1, 2011 at 20:22
  • Hmmmm... yeah, that looks like a bug. Whoops.
    – Jon Seigel
    Commented Aug 2, 2011 at 4:43
  • Okay, I fixed up both queries to exclude closed questions. Unfortunately, I had to chop down the second one to 12 tags as 15 was timing out after 2 minutes. Sorry about that. If you have any other issues, please let me know.
    – Jon Seigel
    Commented Aug 2, 2011 at 4:56
  • Thanks @Jon. That only changed the results slightly, which is a good thing since I'm using it to try and organize an Android tag clean-up. Commented Aug 2, 2011 at 11:27
  • 1
    Results presented here.
    – Jon Seigel
    Commented May 3, 2012 at 22:03
25

On (rare) occasions I'd like to see view statistics. Maybe only for questions with huge view counts, when wondering when those views happened, and what caused spikes, if any.

It would be nice to see a breakdown of how many known and anonymous users are viewing.

ChrisF also asked for referrer details in Is there any analytics information that moderators can access for individual questions?

1
  • As mentioned in my addendum in the question, view stats aren't available due to lack of data. That said, referral data may be available, so I will pursue that if possible.
    – Jon Seigel
    Commented Jun 17, 2011 at 0:26
21

I would like to see more tag stats (I'm sure SEDE already has a bunch).

  • Views, votes, answers per question for each tag.
    This would allow us to compare tags better and also see which tags actually draw the largest audiences. It would be interesting to see the rise and fall of certain tags over time and allow us to 'focus' some more attention on topics that are trending (with the blog for instance). It also surprised me that the OSX and Linux/Ubuntu tags on SU are still on the rise, even though we have dedicated sites for those topics.

  • Tags that draw the most new users, split up for answers and questions.
    When browsing SU, I always wonder which topics should deserve more attention, because they're the life blood of the site. It would also give us an idea about what topics might need some additional moderator attention, because new users often means 'trouble'.

  • Which tags or specific questions (like a top 50) attract the Google masses.
    While we mods can see where our traffic comes from, we don't actually know how where they go to. It might be impossible to to predict which questions/tags are of the most interest, making sure those posts are our top priority surely doesn't hurt. Furthermore, I'm curious how the views are distributed. Are some tags only popular with registered users and de certain tags get dis-proportionally attention from random Google visits.

  • Is there any information about what question made users sign up?
    Like what was the last question or first question they watched before deciding to sign up. I'm just curious as to what might make new users decide to create an account in the first place.


Interesting:

  • get's nearly 6-7x the votes the other tags are getting even though it only has twice the amount of answers/question.
  • Even though there are huge differences in the number of questions, the differences in views/questions are much less dramatic. For example: has 10x the amount of questions as but there's only 110 views/question difference (10%).
  • SU seems to do well on notorious problem makers:
    • These are all topics that are often hard to troubleshoot and are something you'd expect StackExchange to excel at, whether we actually provide a solution is a different question entirely.

Can't really spot anything else that's interesting. Anyone else?

5
  • 1
    +1 Tag trends are very interesting.
    – Jonas
    Commented May 14, 2011 at 22:43
  • Here's the SU one -- I totally gutted the query, so it's decently quick now.
    – Jon Seigel
    Commented Jun 2, 2011 at 1:37
  • Here's the query for the second one -- perhaps surprisingly, it seems highly correlated to overall tag popularity.
    – Jon Seigel
    Commented Jun 16, 2011 at 23:56
  • Also, for 3 and 4, while they are good ideas, there isn't any data available for them. :(
    – Jon Seigel
    Commented Jun 17, 2011 at 0:25
  • No problem @Jon, perhaps the team will start looking in to them if they deem them useful
    – Ivo Flipse
    Commented Jun 17, 2011 at 15:00
15

It's been pretty widely publicized that around 90% of Stack Overflow's traffic comes from Google. That means a lot of unregistered users coming to the site and viewing content, but I'd like to see stats on what other types of activity unregistered users are taking part in.

  • What percentage of questions are posted by unregistered users?
  • What percentage of answers are posted by unregistered users?

I don't know if this is possible, but it would also be interesting to see at what point people typically register. After X questions posted? After they reach a certain reputation?

6
  • 1
    Unregistered edits too? (Is that a thing?)
    – jjnguy
    Commented May 19, 2011 at 13:42
  • @jjnguy: Yes, that's a thing. I think usage of the higher-rep features by unregistered users will tail off, but I would still like to see it. Commented May 19, 2011 at 14:23
  • It might be difficult to work through events like merged accounts, but it would be interesting to see if this is possible.
    – Jon Seigel
    Commented May 19, 2011 at 17:28
  • Okay, done. Unfortunately, this can't be done on SEDE. Quick stats for you: on SO, unregistered activity is 14.4% of questions, 3.4% of answers, 2.8% of edits (May 2011). Both questions and edits are slowly trending upward, while answers is relatively constant.
    – Jon Seigel
    Commented Jul 9, 2011 at 21:03
  • As far as when people register... I'm not sure that information can be recreated from the data I have.
    – Jon Seigel
    Commented Jul 9, 2011 at 21:05
  • Results posted here.
    – Jon Seigel
    Commented May 20, 2012 at 16:31
13

We keep on getting questions about whether it's easier to gain reputation now that it was early on in the site's history.

It would be nice to find this and several other pieces of related information:

For each post, find its vote tally at, say, 48 days after it was posted. This will level the playing field (ie, a question that's been around for 3 years will have more votes than one that's been around for 5 weeks)

Average the above 48-day tally for each time period (monthly, weekly, whatever) and graph it.

Break out the results by post type (question/answer) and perhaps by other interesting factors (whether the author was high rep or low rep, etc).

Graph it so we can see if it's just our imagination, or if reputation really is harder to get these days.

5
  • I've probably got about 5-10 similar queries that I would like to see that can't be done on the data explorer, but I can't take the time to explain them all right now, so I'll try and revisit this later.
    – Pollyanna
    Commented May 13, 2011 at 16:25
  • @Jon, No, not at all. I'll come back and reformat this one so it's more understandable soon.
    – Pollyanna
    Commented May 13, 2011 at 17:01
  • 2
    Annnnd the answer is: yes. data.stackexchange.com/stackoverflow/s/1581/…
    – Jon Seigel
    Commented Jul 9, 2011 at 18:15
  • Great query @Jon!
    – Ivo Flipse
    Commented Jul 13, 2011 at 1:05
  • @Ivo: Thanks! Credit goes to gbn on Stack Overflow for the date component trickery. :)
    – Jon Seigel
    Commented Jul 13, 2011 at 1:26
12

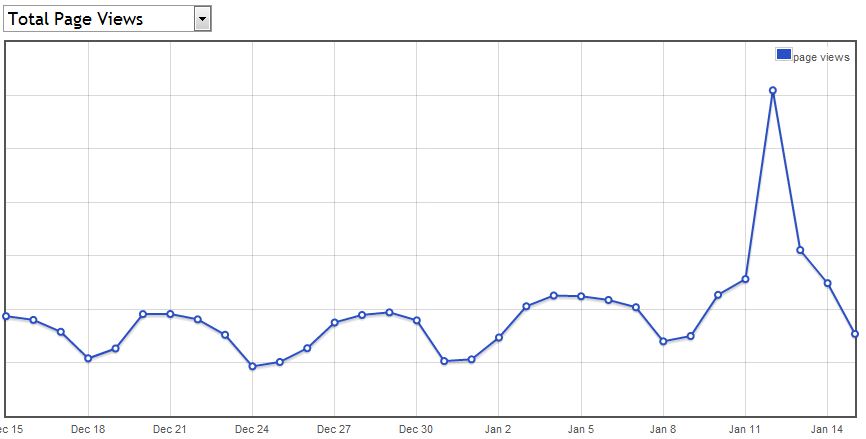
Given the graph in this answer:

average number of views over all time

It would be nice to see a graph like this, but with the average number of views each question gets in the first couple of weeks after it's asked (say 1 or 2), in stead of over all time.

3
  • An overall average on its own really isn't very informative, IMO. What about breaking it down by tag (for example) like Bill suggested with unanswered questions?
    – Jon Seigel
    Commented May 11, 2011 at 16:57
  • @Jon: Indeed, the overall average would only be interesting to back up (or disprove) the claim that the questions on SO overall get fewer views lately. A breakup by tag is definitely a good idea!
    – fretje
    Commented May 11, 2011 at 17:57
  • Per the addendum in the question, the data needed to run these kinds of stats isn't available. While I won't be able to show the community these stats, thank you for your idea!
    – Jon Seigel
    Commented Jun 17, 2011 at 0:29
12

Sportsmanship badge statistics

I believe it would be interesting to see things like:

  • What share of the up-votes come from competing answerers?
  • What is the correlation between eagerness to up-vote competing answers and the reputation? (my guess is it typically takes a >~3k user to give a competitive up-vote)
  • How much time does it take for anyone to up-vote a competing answer? (my feeling is the competing up-votes are often given only after some significant amount of time not just after seeing the answer)
3
  • 3
    +1, I'm interested in this as well. On short answer questions often I'll find 4-5 of us with the same answer ~1 min apart. I'll go through +1-ing, only to find myself at the bottom.
    – user7116
    Commented May 28, 2011 at 1:11
  • 1
    Done. Obviously there's no SEDE query for this because it's all private vote data. Teaser for SO: 3.75% of answer votes; the rep range of 101-499 has almost as many competing votes as 10k+; your hypothesis was correct -- in fact I had to measure the time differences in minutes because using seconds caused an integer overflow -- the average works out that the competing votes are cast ~25 days after an answer is given.
    – Jon Seigel
    Commented Jul 13, 2011 at 3:41
  • Results posted here.
    – Jon Seigel
    Commented May 13, 2012 at 19:41
12

Preamble: I frequently get the impression here on Meta that there are great differences in perception of what constitutes typical SO activity. One person thinks that questions from newbies get closed too quickly; another argues that there are dozens of basic duplicates a week, and they aren't getting closed fast enough. I'm not concerned with these specific arguments at the moment.

I do wonder, though, how much of this difference in perception is caused by differences in tag group behavior. I "hang out in" my four or five major tags, [cocoa], [objc], and related, and another user may focus on a different set of tags, say, [asp.net], [c#], and others that I know nothing about. When I "visit" another tag, the behavior (voting, closing, commenting, even tone of questions and answers) does seem strikingly different. I speculate that these differences in behavior lead to a certain amount of misunderstanding and talking past one another here on Meta. (I'm not sure how to measure the actual behavioral variation by tag; maybe it's possible using SEDE already.)

What I want to know is, how focused, or how generalized, are the members of SO? How much segregation into major tags is there, in fact?

This is what I've come up with to look at that question. I'd like to see a series of N histogram graphs. Take some number X of the most popular tags. (I don't have a clear idea how many X should be; there's 36 on the first page of the Tags tab, so probably no less than that, but I'll leave that to you.) On each graph n, display the number of members y who who have at least n votes in x of the top X tags. I'd probably expect n to increase in a super-linear fashion (10, 20, 50, 150?), depending on how many graphs you feel like producing.

Example:

n = 10
Number of members 
 10k|  *
    |  *  *
    |  *  *
    |  *  *     *
    |  *  *     *  *
    |  *  *     *  *  *
  1k|  *  *  *  *  *  *  *  *
    |  *  *  *  *  *  *  *  * 
    |  *  *  *  *  *  *  *  *  *
 100|  *  *  *  *  *  *  *  *  *  *
    |  *  *  *  *  *  *  *  *  *  *
    |__*__*__*__*__*__*__*__*__*__*___
   0   1  2  3  4  5  6  7  8  9  10
Number of top tags in which member has at least 10 upvotes

I'm no statistics wiz, so if there's a better way to display this info than what I've thought up, I'm all for it. Also, if anyone else is interested in this segregation question, and has a better idea for how to look at it, please comment! There's some intuitively obvious correlations among various tags, for instance, but it might be nice to see real data on that, too.

1
  • This is a really good idea, but my stats knowledge is a bit lacking to make this happen. I will see what I can do, though.
    – Jon Seigel
    Commented Jun 17, 2011 at 0:24
11

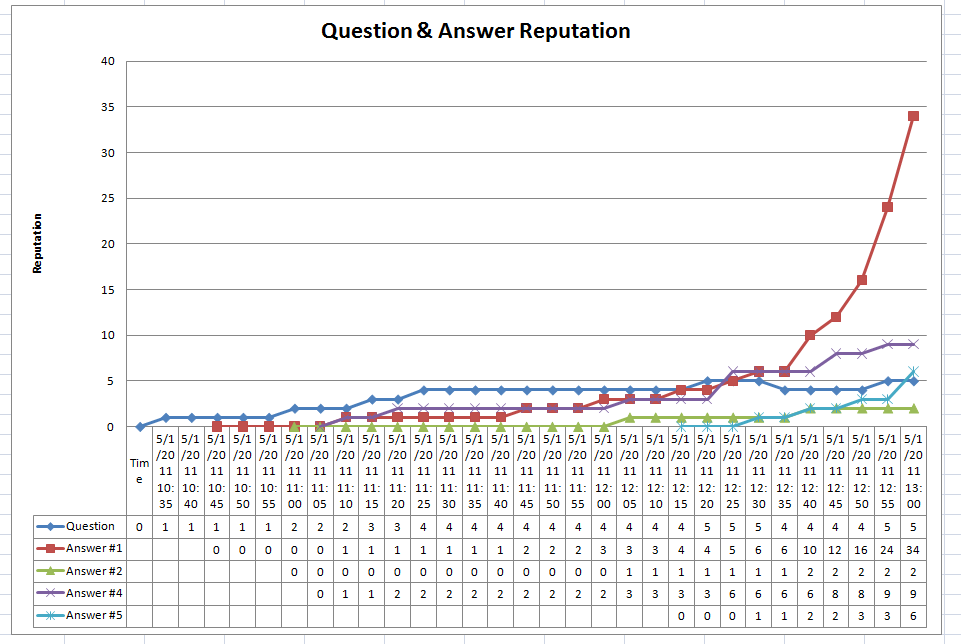
I would like to be able to generate a Question Reputation Cumulative graph to analyze various community user's behaviors.

enter image description here

Data set must contain the reputation level of the question and all its answer for each time component within the selected period.

8
  • Doesn't this violate rule #2, "We won't run stats for any single account: the idea is to reveal community/network patterns" -- or have I misunderstood?
    – Jon Seigel
    Commented May 8, 2011 at 14:21
  • In that statement, you want to analyze community/network patterns, I feel knowing how reputation is spread across answers of a given question over time is a very interesting one.
    – user150926
    Commented May 8, 2011 at 15:06
  • @Pierre: So you're saying to generate a graph like you showed, but essentially as an average over all questions and answers?
    – Jon Seigel
    Commented May 8, 2011 at 15:36
  • @Jon Seigel: no there is one serie for the question and a serie for each answer.
    – user150926
    Commented May 8, 2011 at 17:28
  • 3
    @Pierre: ... This is an interesting graph to view, but we aren't interested in looking at individual questions here.
    – Jon Seigel
    Commented May 8, 2011 at 18:28
  • @Jon Seigel: I'm not interested in individual questions either.
    – user150926
    Commented May 8, 2011 at 18:41
  • 1
    @Jon If I understand Pierre correctly, he's proposing measuring each question separately and then analysing trends, not individual questions, i.e., correlations between the upvotes of highest voted answer and upvotes of the question, etc.
    – Aleadam
    Commented May 13, 2011 at 13:13
  • @Aleadam: yes, I want to understand specific trends globally. But analyzing specific questions may be interested too.
    – user150926
    Commented May 13, 2011 at 13:16
10

I would like to see stats on suggested edits, so we can know if more people should be able to see the list of suggested edits.

1
  • Done. Answered in that question.
    – Jon Seigel
    Commented Jul 10, 2011 at 0:43
10

After reading these two discussions:

6
  • 7
    Yes user country per SE site would be nice. One of the downsides of SEDE is that you can't easily do multi-site analysis.
    – Benjol
    Commented May 13, 2011 at 8:43
  • 4
    The multi-site analysis idea would be interesting @Benjol. I'm curious how users are distributed over all the different sites and what the 'success rate' of their participation is. How many users actually gain more than 200 rep on multiple sites for instance or how much correlation is there between having rep on the Trilogy and on new sites?
    – Ivo Flipse
    Commented May 13, 2011 at 13:47
  • Here's the per-site query that shows user locations. I'll do a multi-site version later.
    – Jon Seigel
    Commented Jun 17, 2011 at 2:13
  • @Jon great job, thanks! It looks like non-native English speakers are not a small percent of SO users after all.
    – yms
    Commented Jun 17, 2011 at 3:06
  • Here is the all-sites query -- since SO is so large, it pretty much dominates the results. While there are many users from non-English speaking countries, it's debatable whether all of them speak English as a second language. Proportionally speaking, the United States has ~13x the population representation as that of India -- it's plausible that a great deal of those are native English speakers.
    – Jon Seigel
    Commented May 9, 2012 at 1:31
  • I've consolidated a few more "country" entries here. It didn't affect much of the top 70 or so.
    – Mark Hurd
    Commented May 10, 2012 at 15:59
7
+250

I would like to see more cross-network statistics:

  • Top users by cumulative reputation
  • Listing of users who have at least 2000 1000 and 500 rep on at least 15 - 10 - 5 network sites
  • Most active users by time spent across network
  • Number of active profiles with only 1 visit to site
  • Number of question askers who visit once and never come back
2
  • I decided it's Too Difficult(tm) to isolate individual accounts across the network (where do I pull the user name from?), so I'm only going to do aggregate statistics for these. Also, the first item is a bit pointless because they'd all be from SO.
    – Jon Seigel
    Commented Jul 17, 2011 at 17:03
  • Here's some network-wide reputation stats: data.stackexchange.com/stackoverflow/s/1611/…
    – Jon Seigel
    Commented Jul 17, 2011 at 17:04
6

How many votes do questions/answers see based on the time of day they were posted?

Despite the response to my question on this topic, I still sense that having all votes reset on the same clock must adversely affect questions and answers posted during a particular portion of the day (when most people who vote have no votes left).

2
5

I don't have the exact idea for visualization (graph), but...

It would be nice to know how strong is the effect of first up-votes on answers. Meaning, how often is it the case it's enough to get the first one or two votes among a few answers to win the whole 'race' (i.e. get the answer accepted or have the most number of up-votes after 2 days or a week).

4

I was just thinking of asking for some statistics just 30 seconds ago for a paper I am writing . Ask and you shall receive I guess.

I would love to see very detailed statistics shows the patterns when questions get migrated around the SE network. I'm interested in seeing if migrating questions is really a good thing with the new SE sites. (personally I think it need an overhaul)

Things that could get included:

  1. votes before and after move
  2. number of answers before and after move
  3. quality of answers before and after move
  4. views before and after move with timeline
  5. source, destination
  6. comment count
  7. tags of question
  8. reputation of author on both sites
  9. amount of time author spends on both sites (reading, how often hes logged in,...)

Also I would like to see statistics that show the patterns over users and how they interact with the different SE sites. Hopefully I'll be able to create a user map that shows which type of users frequent which sites. Where these different types of users generally cross paths.

  1. Reputation map on different sites
  2. number of questions moved
  3. number of questions closed
  4. time spent on different sites
  5. commonly used tags
  6. part of the world / timezone

I'm sure I'll think of some more useful things later.

2
  • Hmmm... good ideas, but can you focus what you'd like to see? This is a whole subproject in itself. Thanks.
    – Jon Seigel
    Commented May 11, 2011 at 16:42
  • I'll work on focusing this a bit. I have to take a look and see what I can get through SEDE. I know this is a subproject in itself but it'll be worth it I think and very useful to the SO community.
    – WalterJ89
    Commented May 12, 2011 at 6:40
4

Maybe a bit vague, but I like to see the relation between proposed behavioural changes (for example the blog post to vote for questions) and the real behavioural changes.

In this case, it should be easy, compare the relative number of votes on questions before and after. But the most interesting part would be to check if the change is lasting by monitoring it for a longer time.

Another example would be the relative number of bad questions before and after the restriction on bad question.

If several of these metrics are in effect over a longer time, it would be interesting to compare the effects of positive (rewards, badges, reputation) triggers and negative (question restrictions, penalties).

4

Many people believe that number of views drives everything else that we measure. The number of upvotes you might get for a question, answer, or comment, the number of answers the question attracts, the quality of the answers, and so on. That's why the main page landing view was adjusted - to try to get views to questions. I'd like to know if that is actually true. Is the range of "views per upvote" dramatically narrower than the range of upvotes? Can you see a similarity in the shapes of say views each day within a tag and votes or answers each day within that same tag?

If it turns out views is overwhelmingly the driving factor behind all the other outputs, that drives a different set of behaviours than if you see some situations with the same view pattern but a very different pattern of votes or answers.

1
  • "views each day" -- that data does not exist (see the addendum I added to the question). The rest seems doable.
    – Jon Seigel
    Commented May 15, 2011 at 14:04
4

I expect that before flag weight was visible, flags in each tag appeared in rough proportion to how many questions and answers there were in that tag, and who was following the tag. But with the rise of searches to find bad answers, and the review page gaining discoverability, flags probably started to appear in proportion to where bad posts were, which is different. Say almost everyone who posts in tag A is Doing it Wrong, and nearly nobody in tag B is, but B gets way more views and posts. In the old days, B would get more flags than A, but now I bet A gets more. Can you design a query that would test this?

4

I would be interested to see the flagging distribution and trends over the last 3 months.

  • How many people have flagged and how frequently.

  • How many people have what success rates (ignore users who have only raised a few flags).

  • Are people improving. For users that have raised at least 200 flags, compare the success rate of the last 100 to the success rate of the 100 before.

I imagine these would produce nice bell curves (because bell curves are awesome) but I find my imagination is not nearly as informative as real data.

4

Average patterns across the day and week of when votes are cast on questions and answers.

When are you most likely to see a flurry of upvotes or downvotes on a post? Before lunch? After happy hour?

Views is one thing. But votes, baby, that's an action you get hit in the face with like a skin tag that comes off when necking.

2
  • Good idea. I've been kind of curious about that myself.
    – Jon Seigel
    Commented Aug 3, 2011 at 0:50
  • I was just researching whether I could get statistics like these and ended up at this question/answer. Personally I'm curious to see stats on whether the questions during the weekend are usually much worse than during the week. Commented Oct 5, 2013 at 16:51
3

I'd be interested in seeing some data comparing question voting counts both before and after making downvotes free. Also see if there's any correlation to closings and deletes.

At this point in time, I wouldn't expect to see much yet since this was a recent change but it has already made a drastic change to my voting habits and I'm curious to see if the feeling is mutual.

1
  • I'm sure the team will be tracking this anyway. What I think needs to happen is the data has to be normalized against the number of active users in the system (this is lacking in the graphs Jeff and I posted) -- seeing an increase in voting could simply be a function of more users in the system.
    – Jon Seigel
    Commented May 15, 2011 at 14:14
3

I would like to see referrer information for questions where I've made a post. Just today I had 4 votes on a answer I wrote over a year ago: it'd be awesome to be able to see what was sending new traffic to this old question.

I may create this as a separate meta request

3
  • I like the idea, but I'm only looking at aggregate stats here. Can you edit your idea to turn it into something more general?
    – Jon Seigel
    Commented Jul 20, 2011 at 16:21
  • @Jon - see: meta.stackexchange.com/questions/99042/… Commented Jul 20, 2011 at 16:26
  • As I said, it would be interesting to find out on a personal level; we aren't looking at individual accounts with these statistics, though.
    – Jon Seigel
    Commented Jul 20, 2011 at 16:44
2

How has the site's "negativity" (which may be a good thing) changed over time? What percent of questions are closed and downvoted over time? What percentage are duplicates?

This may provide insight into the maturity of a site.

1
  • 1
    They took away my [subjective] tag, and now because I can't filter out the noise questions, I use a TON of close votes every day.
    – user7116
    Commented May 28, 2011 at 1:08
2

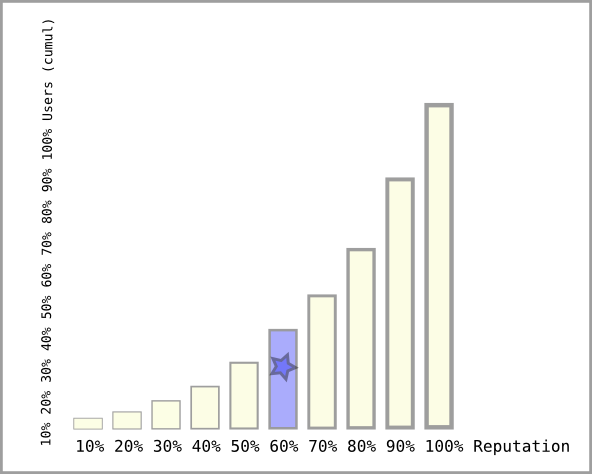
I would like to see an x-y-Diagram. On the x-axis, the percentage of reputation (cumulative), on the y-Axis the number of users in % with that reputation. And an indicator, where you are (I am) in that diagram:

reputation distribution

This graph would mean, that about 60% of the users have less reputation than you, and that these users together collected 40% of the reputation.

An additional indicator (*) could locate an individual in a segment, builded by all the people in an 1% interval (this sample is with 10% intervals), which have a similar reputation - let's say - of 713 to 849 points. If you sort all those people by joining date, and indicate where in that section a person is, everybody above the middle (=average) would be a faster reputation earner, and those below the middle would be slower.

(Updated, and replaced ascii-art with inkscape graph).

2
  • 1
    I'm sorry, but the first paragraph makes no sense given the graph (if I undo the rotation transform I get an x-axis that goes from 100% to 0%). Can you simply label the graph's axes as shown? That would make the explanation part redundant. Also, as I said above, we are not going to be running stats for individual accounts (the basic idea is okay, though).
    – Jon Seigel
    Commented May 14, 2011 at 18:27
  • Yes. Maybe I do a better one with inkscape. The form it is now, I could do it with one line of code (1 to 15).map (x => 1 + r.nextInt (15) * r.nextInt (15)).sorted.map (n => List.fill (n)('.').mkString ("")).mkString ("\n") Commented May 14, 2011 at 20:53
2

I'm not sure if this information is available to you but I'd also be interested in seeing how much of the hits on questions and answers are coming from internal and external sources (hits from google, facebook, twitter, reddit, someone's personal blog, etc.)

It'd be interesting to see how much of a question's 100k+ views came from a particular source. Or to be able to see if a question that makes a reference to another existing question contributes to the view count of the question.

1
  • Referral (not view) information is tracked, so I don't think that can answer the question. Investigating referrals would be interesting; however, it's based on HTTP referrer information, which isn't always included in browser requests. Peeking at SF data, 23% of the referrals have referrer information, so I'm not sure if that's enough data to accurately answer the question either. :( +1 for a good idea, though.
    – Jon Seigel
    Commented May 15, 2011 at 14:11
2

This question had me thinking. With currently many registered users (not including previously active but now deleted users), I wonder how much of that are actually active users.

It'd be nice to see a breakdown of how many users are actually active by "reputation class" (i.e., below 100, then up to 1k, then up to 5k, then up to 10k, etc.). Active meaning they've logged in and made a post (i.e., question, answer or comment) or any other action where a change is made to the public side of the site (changing the private profile doesn't count). If possible, do this for each month since the sites have started up. Maybe add account registration/deletion statistics, maybe even include unregistered users.

1

To me it seems strange that it should still be so complicated to implement a time series of the views for each question. I have just posted a workaround at Workaround as view statistics are not stored: “Save time series of the views of all questions” to a user file. And: “Upload file for stats” on SE site, and yet I do not see this as a good step to save your statistics locally.

Is it possible that the refused feature request of the past to get view statistics per question is simply outdated due to advanced technical possibilities in 2020? Quoting from the question:

For those who made suggestions for statistics based on question views, I have bad news, unfortunately: Jeff informed me that detailed view data is not stored in the database. Although these stats won't be presented, thank you very much for your suggestions!

It seems that in 2020, there might be much more database capacity and performance to store this in the SE database. It might be that the older feature requests are simply outdated, not regarding their request, but in that they would not have to be refused nowadays anymore. It would be a very interesting feature, whether it is your own question or a question of another one. Of course, votes can also help to reconstruct a time series a bit, but why not making a more general approach? This would also help analysing trends of tags and keywords.

0

A list to determine what questions have the most duplicates, this would yield very interesting and perhaps even useful results on the SOFU sites. I was trying to get this in the Data Explorer, but seems I can't...

0

I do not know if you are still producing graphs as offered, but here is someone you could help by producing a plot of time series (better: a dataset) showing how stats software fare at SO/SE (specifically, SO and CrossValidated). The tags: r, sas, spss, stata.

The author of the post writes about the data he currently has:

This data is cumulative, but it would be very interesting to see how it grew by year. Without access to such data, at least we have the data in Fig. 1a to give us a feel for history.

If you have time series data, please send it over to him! If you cannot send the data, you could also ask the SO/CV teams to get it for him :) Bob Muenchen will be finalising his analysis of stats software discussion in the coming weeks.

Cherry on top: a crosstab of associations between the keywords. I'm pretty sure it would show that quite a few R questions are about transitioning from Stata.

You must log in to answer this question.

Not the answer you're looking for? Browse other questions tagged .