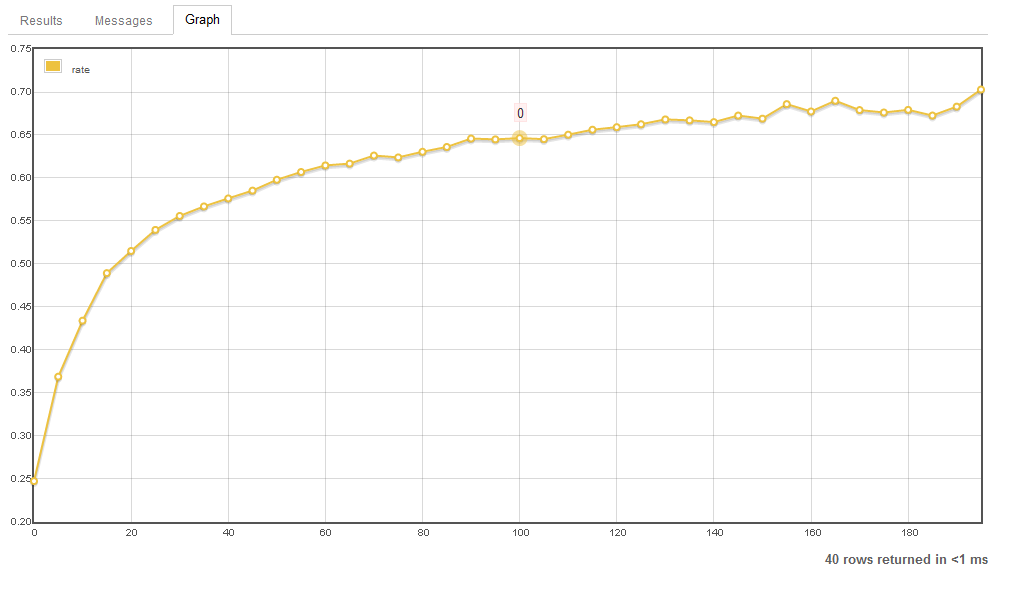
Whenever a graph is created with Data Explorer using a query that returns non-integers, the tooltips which appear when hovering over the data points are rounded to integers.
This is a problem, for instance, when viewing a graph which only returns percentages in decimal form: (graph taken from this query)

Although the issue can be fixed with this particular query by scaling all the points vertically by a factor of 100, "hackish" methods like these evidently won't work for all queries that naturally return decimal numbers.
