Okay, I'll take a bite on site quality metrics, liberally borrowing some ideas that have been floated on MSE. Here are the broad sections that are IMO essential to judge the progress of a site on a continuing basis:
- Users
- Questions
- Answers
- Moderation
While some of the metrics have been implemented in SEDE queries, it makes sense to assemble them in one place for perusal by mods and CMs, and the general public, if possible.
Users
The most important bunch of metrics.
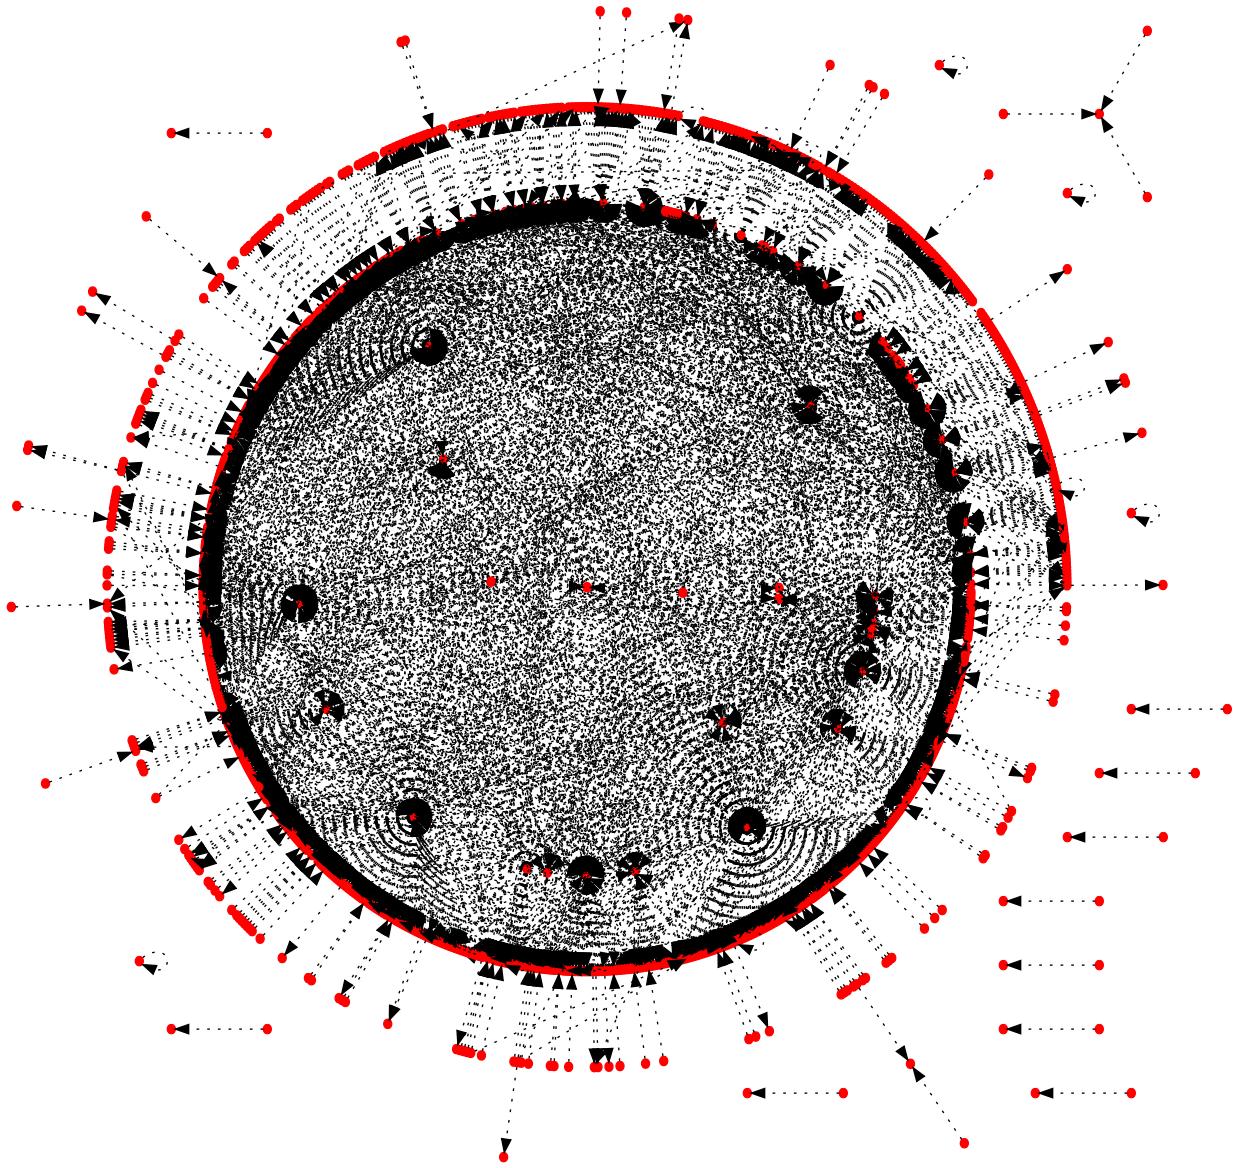
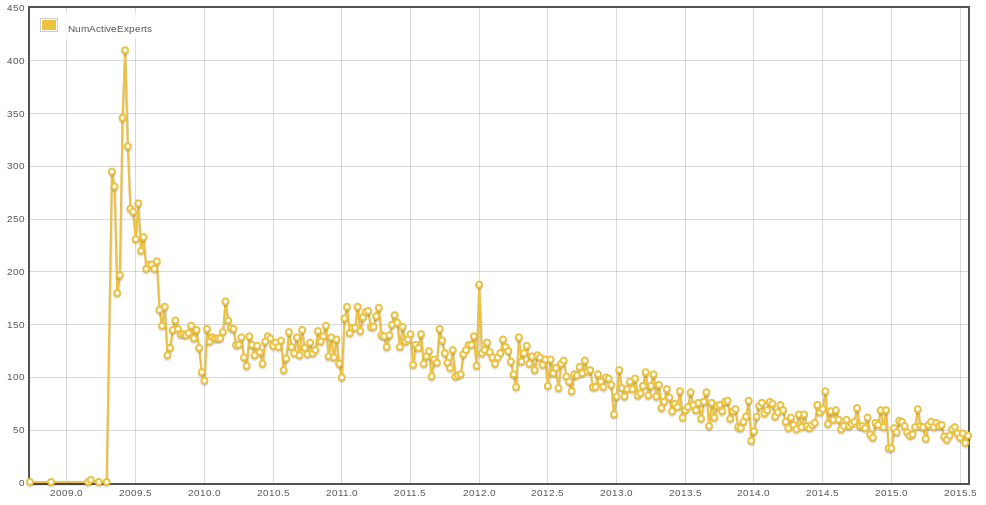
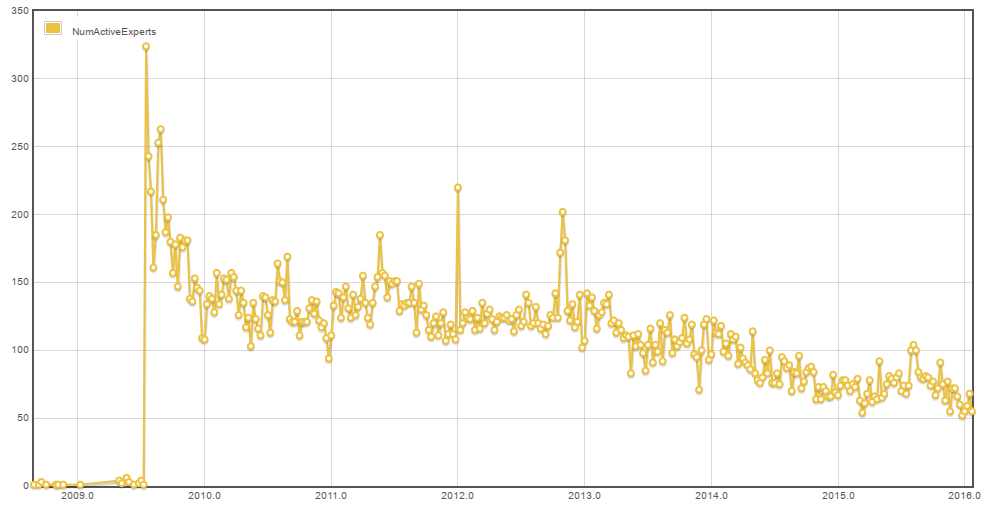
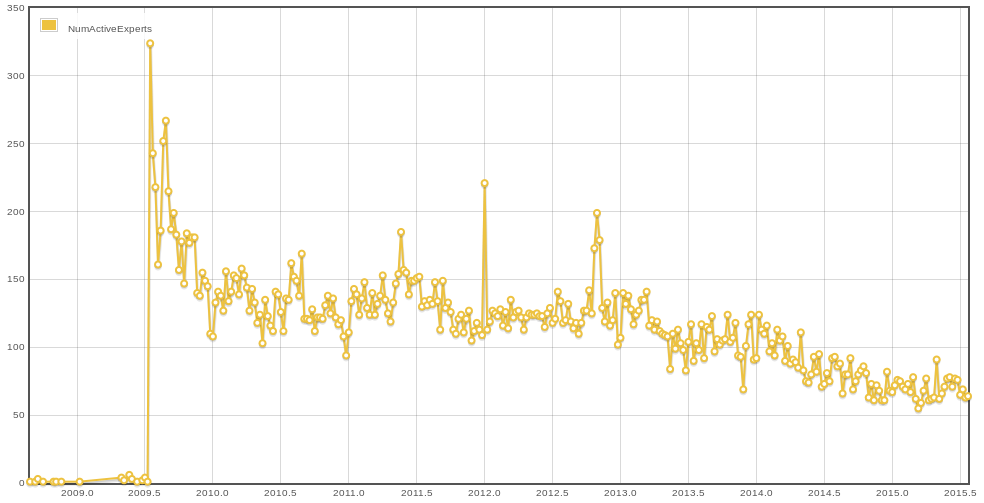
- How many users have posted two or more upvoted answers last week? It is better to show the distribution rather than totals. That's the expert core of the site <1>.
Below: a graph depicting users at Space Exploration SE as nodes and edges (from X to Y) corresponding to "User X answers with a positive score a question with a positive score from User Y". The hell inside is actually the core.
- How does the size of the core last week compare with the same metric six months ago (expert core growth)? (Ideally, a time series graph is needed here) Actual implementation courtesy of Isaac Moses is here as a SEDE query/graph.
Critique of the query by Shog9 - old posts gathering votes with time (and thus skewing the statistics)
As an illustration here are the graphs for the original trilogy:
As of January 2016 (to show that the trends persist):
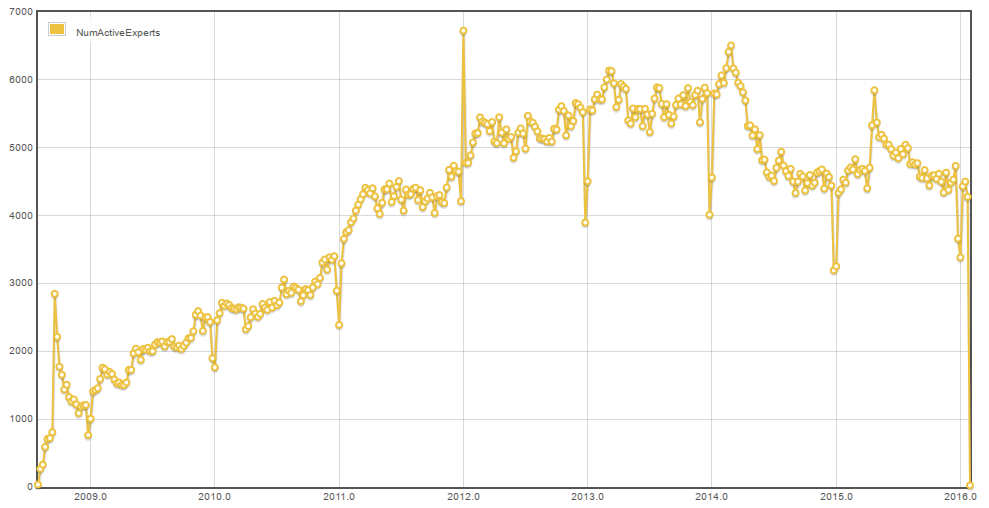
July 2015:
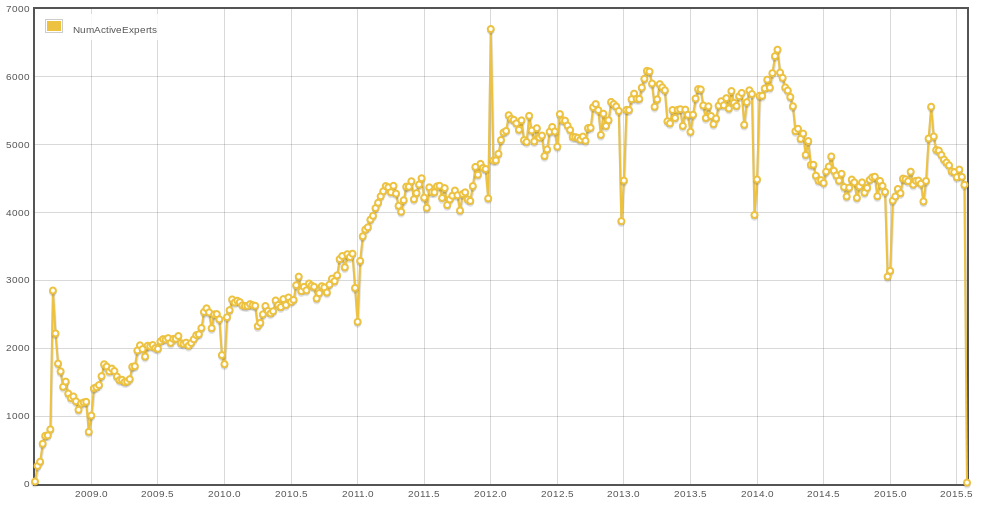
Stack Overflow core
January 2016
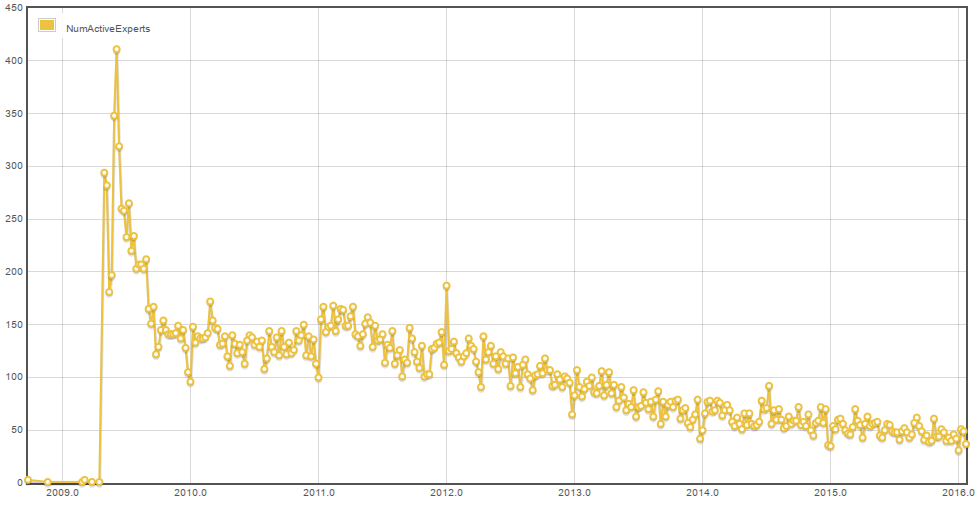
July 2015
Server Fault core
January 2016
July 2015
Super User core
- What is the proportion of core users from
six months a year ago that is still present in last week's numbers? This measures (100% - expert burnout rate). If core users get bored quickly, it's a problem.
SEDE query
(100% - yearly burnout rate, measured on week 15 to avoid Northern Hemisphere's vacation period)
             2010   2011   2012   2013   2014   2015
SO          80.71  78.32  80.32  82.14  84.51  82.17
SF           Jeff  81.51  83.57  82.60  78.04  87.27
SU            N/A  90.90  84.80  86.72  91.07  89.88
Mathematics   N/A    N/A  63.30  69.84  69.55  71.39
U&L           N/A    N/A  70.00  88.09  74.07  80.70
- Average number of votes per user per day, averaged over the whole user base last week. (voting engagement)
- Same as above minus upvotes from users with 101 reputation. It's a correction for SuperCollider drive-by voting (corrected voting engagement).
Questions
Self-evaluation conflated assessment of questions and answers. It's better to keep these items separate.
- Number of questions per day last week and last month. Self explanatory in view of new graduation guidelines, but the numbers must be current. The Area51 QPD number is unclear and is not sufficient.
- The ratio of closed/deleted/zero or negative votescore questions to the total number of questions asked last month (noise ratio).
- Number of views per one asked, positive votescore, not closed nor deleted question last month (1 / view to question conversion).
- (tiphat to D.W.) Proportion of "questions with positive score where all answers have zero score" (drive-by "demoralizing" questions' ratio) last month.
- Number of questions reaching the SuperCollider aka "Hot Network Questions" last month. Self-explanatory - rather than lament the algorithm and side effects, we have to measure the network-wide site visibility.
Answers
- Average length of answers, in words. Averaged over last month. If the experts are too lazy to type, it's a problem for the site. A distribution would be nice.
- Average number of hyperlinks/book or paper references per answer, for answers with positive score only. Averaged over last month. Not sure how to automate this one - refs come in all guises, no single regex can capture the whole complexity. This metric is not for cross-site comparisons, yet it is known that great answers make use of equations/pictures/schematics/hyperlinks/references/code snippets and one picture is worth a thousand words. This also helps to retain readers' attention. For lack of a better term I'd dub it "rich content ratio".
Moderation
- Average size of moderation queues over last week. Samples are taken each hour. (key moderation metric)
- Proportion of failed audits (if enabled) last month.
- Proportion of split-vote moderation actions last week.
- Ratio of actions resolved without a moderator's binding vote to total number of actions last week (1 - moderator escalation ratio - alternative names are welcome)
- Total number of actions resolved last month by CMs.
- Ratio of salvaged (closed, edited, reopened) questions to the total number of noise (closed and deleted) questions (averaged over last month), courtesy of TildalWave, and aptly named the Tildal Wave Ratio, or salvaged questions ratio.
- Number of non-moderator reviewers/closevoters with more than 5 actions last week (moderation core size). (SEDE query on edit reviews, both mods and non-mods)
- How many members of moderation core from six months ago have been still actively moderating last week (again, 1 - moderation burnout rate)?
- Ratio of new meta views last week to main site views during the same period (meta relevance ratio).
Rationale for the choice of averaging periods
StackExchange activity changes a lot depending on day of week. A week is chosen for averaging to eliminate this effect and to maintain interest of CMs, mods and users in watching changing numbers (it's not fun when the number stays the same all the time).
Rare events are averaged over a month (last four calendar weeks, to be precise).
Footnotes:
- One can mentally call this number the site's bus factor.


